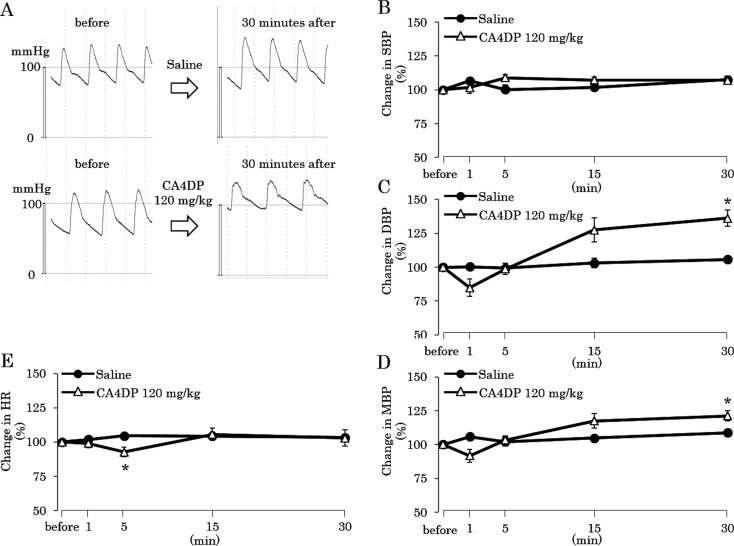
Fig. 4.
Time-response curves of BP of rats given CA4DP or saline. A: Blood pressure tracings in rats given CA4DP 120 mg/10 mL/kg or saline 10 mL/kg. B: Time course of SBP change in response to a single intravenous injection of CA4DP 120 mg/10 mL/kg or saline 10 mL/kg. The SBP of CA4DP-treated rats did not change throughout the recording period. C: Time course of DBP change in response to a single intravenous injection of CA4DP 120 mg/10 mL/kg or saline 10 mL/kg. The DBP of CA4DP-treated rats became higher than that of saline 10 mL/kg-treated rats at 30 minutes after administration. D: Time course of MBP change in response to a single intravenous injection of CA4DP 120 mg/10 mL/kg or saline 10 mL/kg. The MBP of CA4DP-treated rats became higher than that of saline 10 mL/kg-treated rats at 30 minutes after administration. E: Time course of HR change in response to a single intravenous injection of CA4DP 120 mg/10 mL/kg or saline 10 mL/kg. The HR of CA4DP 120 mg/10 mL/kg-treated rats decreased slightly at 5 minutes after administration. B–E: Each dot represents a mean ± SE. *: p<0.05 compared with rats given saline.

