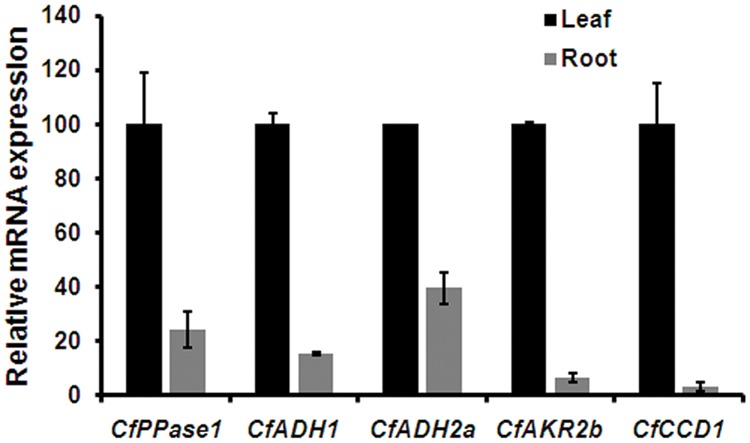
FIGURE 6.

Tissue specific expression of candidate genes in C. flexuosus. Real-time qPCR analysis of candidate genes in leaf and root of C. flexuosus. The expression in leaf was set to 100 to determine the relative abundances of mRNA in root. CfEF1α was used as endogenous control for normalization. Each data point represents the mean ± standard error (SE).
