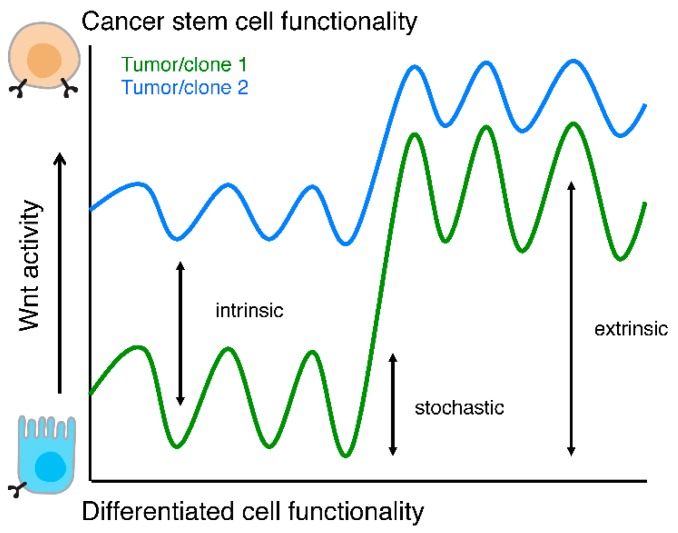
Figure 3.
Wnt activity levels and functionality. Schematic representation of cellular functionality as a function of Wnt activity levels. Two tumors or clones are depicted (green and blue lines) to highlight that intrinsic Wnt activity levels, stochastic fluctuations, and responses to extra cellular stimuli are different between two (epi)genetically distinct populations.

