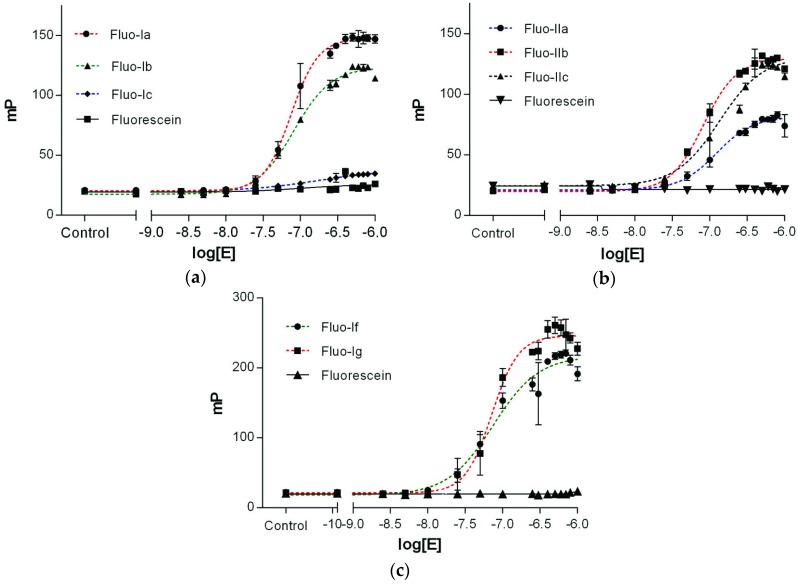
Figure 3.
Dose-response curve for the binding of Fluo-(I–II) to the Epsilon protein. The fluorescent-labeled peptides Fluo-(I–II) at a concentration of 10 nM were treated with increasing concentrations of Epsilon (from 0.05 nM to 2.5 µM) in 10 mM HEPES assay buffer, pH 7.5, with 0.1% Tween-20. Values are plotted as the means ± standard deviation (n = 3) from three independent experiments. (a) Peptide Fluo-Ia (●); Fluo-Ib (▲); Fluo-Ic (♦); (b) Fluo-IIa (●); Fluo-IIb (■); Fluo-IIc (▲); (c) Fluo-If (●) and Fluo-Ig (■). Nonspecific binding of fluorescein in graphs a, b, c is plotted as black (■), (▼), (▲) respectively.

