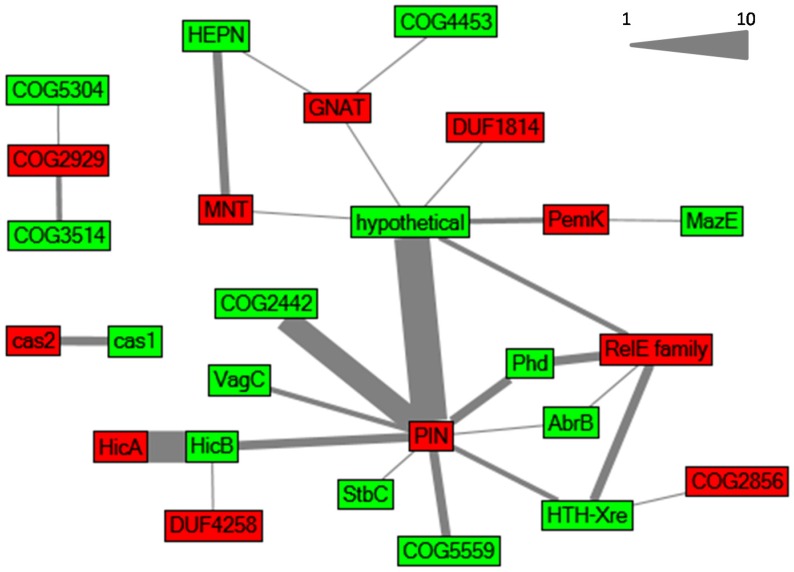
Figure 2.
Relationships between different toxin and antitoxin families in Synechocystis 6803, illustrated in a network graph inspired by Makarova et al. [3]. Toxin and antitoxin families are depicted in red and green, respectively. The edges connect toxin and antitoxin families that were identified as cognate toxic and antitoxic components organized in a putative TA operon. The thickness of an edge is proportional to the abundance of the toxin–antitoxin combination. The scale represents the correlation between operon abundance and line thickness.

