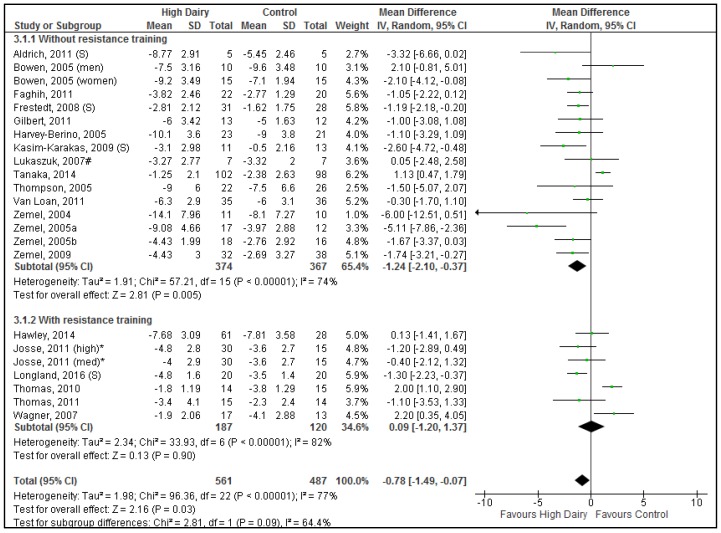
Figure 3.
Forrest plot of mean (95% CI) weighted differences in body fat mass (kg) between high dairy and control groups stratified for sub-groups with resistance training vs. without resistance training. Results when Tanaka, 2014 excluded: −1.41 kg [−2.04, −0.77 kg], Z = 4.86 (p < 0.001); Heterogeneity: Chi2 = 22.61, df = 15 (p = 0.09). (S) The intervention was dairy supplements; # The comparison group was soy protein; * Sample size adapted for multiple comparisons to avoid data duplication; med, medium dairy group; high, high dairy group.

