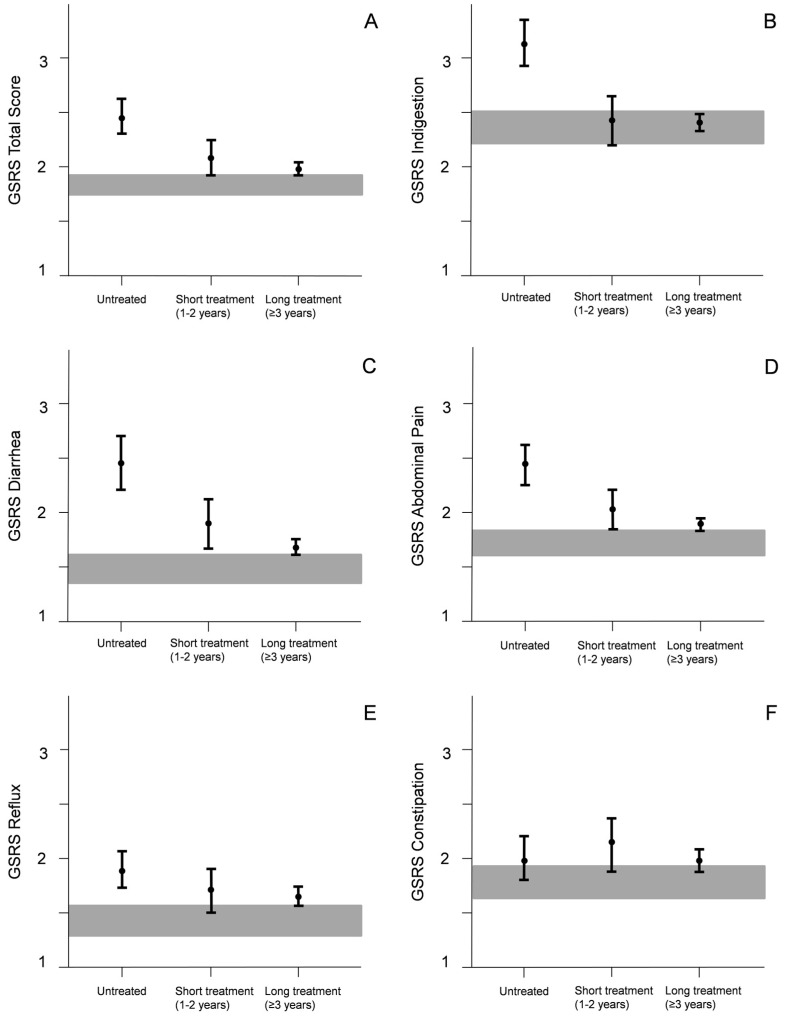
Figure 1.
Gastrointestinal Symptom Rating Scale (GSRS) total (A) and sub-dimension (B–F) scores in untreated, short-term treated and long-term treated patients compared with healthy controls. Values are expressed as means with 95% confidence intervals (CI) and gray bars denote 95% CIs of controls. There were significant differences between the groups as follows: (A) Untreated patients and all other groups (p < 0.001), and short-term treated patients and healthy controls (p = 0.03); (B) Untreated and all other groups (p < 0.001); (C) Untreated and short-term treated (p = 0.015) and long-term treated (p < 0.001) patients, and short-term treated patients and healthy controls (p = 0.010); (D) Untreated patients and all other groups (p < 0.001); (E) Healthy controls and untreated (p < 0.001) and long-term treated (p = 0.013) patients.

