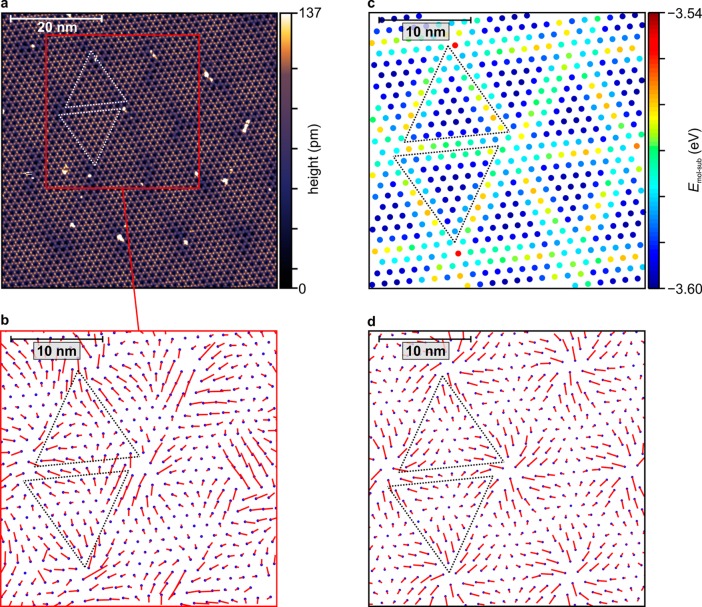
Figure 2.
(a) STM image of 1 ML of HBC on NG, at 1.2 K with a sample bias of +3 V and a set point of 2 pA, corrected only for plane tilt, with a color scale adapted to enhance the subtle Moiré pattern, marked by dotted triangles as guides to the eye. (b) Reference lattice (blue dots) corresponding to the LT structure (cf.Table 1) and molecular displacements (red lines) determined from panel a, magnified by a factor of 15. (c) Molecular positions and calculated Moiré pattern in the molecule–substrate energy after relaxation. (d) Molecular starting positions and calculated displacements, magnified by a factor of 15 as well. Images b–d have the same lateral scale.

