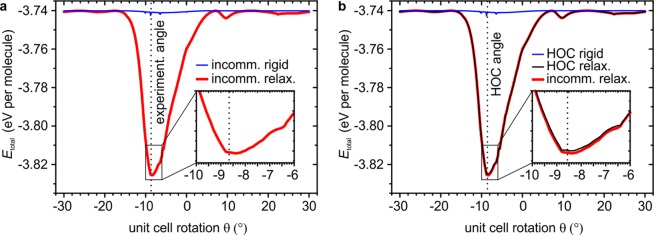
Figure 3.
(a) Total adsorption energy per molecule before (thin blue line) and after (thick red line) relaxation of an HBC domain with 10,981 molecules (diameter approximately 170 nm), initially separated by the experimental lattice constant of 13.95 Å, versus unit cell rotation θ of the starting configuration with respect to graphite. The global minimum of the red curve at −8.5 ± 0.2° is in excellent agreement with the rotation angle of −8.66 ± 0.02° determined experimentally (dotted vertical line). (b) A similar calculation, but with a lattice constant of 13.9552 Å that exactly produces an HOC coincidence at θ = −8.57° (dotted vertical line), being comparable but not identical to the measured LT structure. Importantly, without relaxation (thin blue line), the HOC structure does not produce any sizable epitaxial energy gain, which demonstrates that the lattice coincidence alone is not able to explain the experimentally found alignment. Vice versa, after relaxation (thin black line) no additional epitaxial energy gain at θ = −8.57° compared to the relaxed incommensurate structure from panel a (replotted here in red) is found for the HOC structure.

