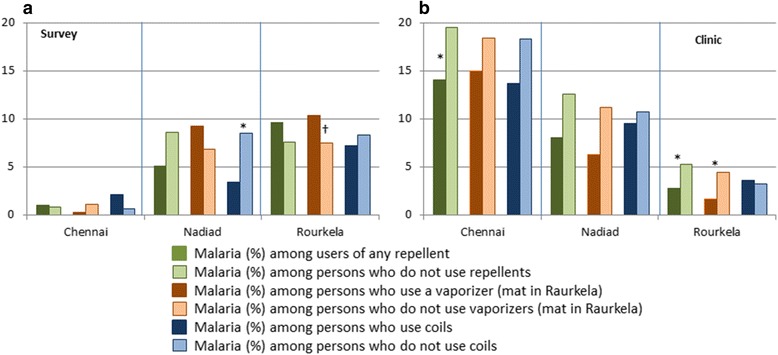
Fig. 3.

Prevalence of microscopic malaria among users and non-users of repellents by study setting and type of repellent in three sites in India, 2012–2015. The data for this graph are available in the Additional file 1: Table S7. *P < 0.05 for malaria among users vs no users (Chi-square test: χ 2 = 6.10, df = 1, P = 0.01 for coils in survey in Nadiad, χ 2 = 4.67, df = 1, P = 0.03 for any repellent in clinic study in Chennai, χ 2 = 6.25, df = 1, P = 0.01 and χ 2 = 10.69, df = 1, P = 0.001 for any repellent and vaporizers in clinic study in Raurkela, respectively). †In the survey in Raurkela, mats were reported to be used and not vaporizers
