Fig. 2.

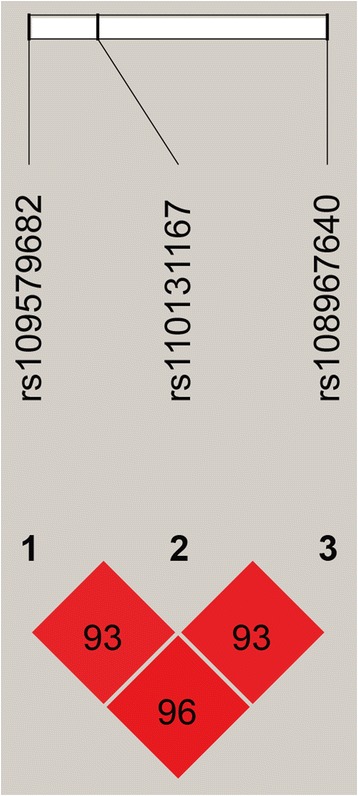
Linkage disequilibrium (LD) plot for three SNPs in PPARGC1A. The values in boxes are pair-wise SNP correlations (D’), the brighter shade of red indicates higher linkage disequilibrium

Linkage disequilibrium (LD) plot for three SNPs in PPARGC1A. The values in boxes are pair-wise SNP correlations (D’), the brighter shade of red indicates higher linkage disequilibrium