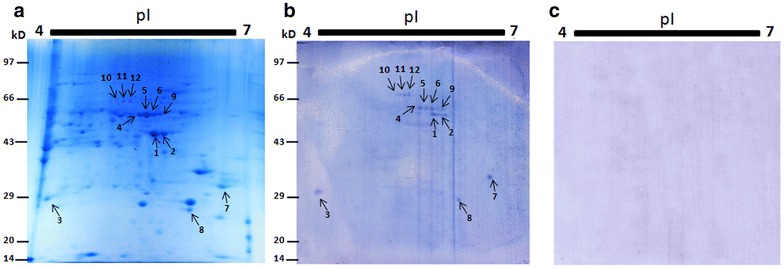
Fig. 3.

Identification IgE reactive proteins from the two dimensional map of Lantana camara. a 2D gel profile of the total protein extracted from LC and marked with arrows of IgE reactive. spots corresponding to immunoblot analysis; M: molecular marker, b 2D-IgE specific immunoblots revealed IgE reactive spots in 7 cm gel. c 2D immunoblot with healthy patient sera as negative control
