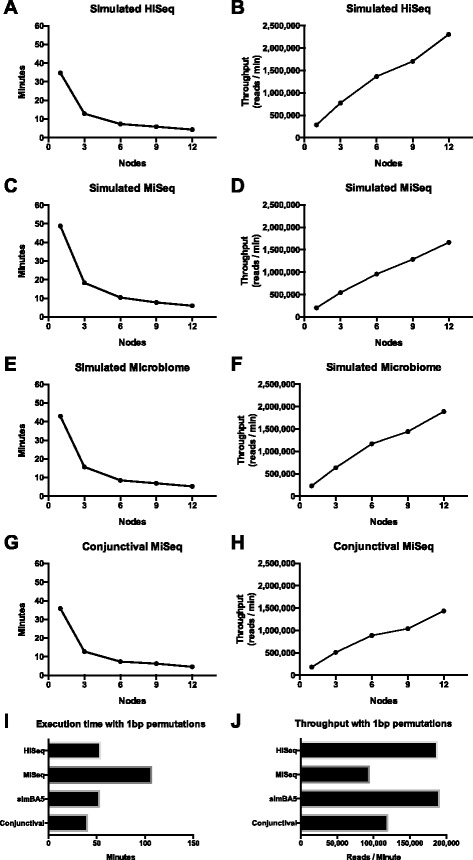
Fig. 3.

Computational scalability of SMART on a computing cluster using the Genbank library. a, c, e, g Overall execution time to complete processing of datasets with increasing number of computing nodes utilized. b, d, f, h Throughput measured in reads per minute processed with increasing number of computing nodes utilized. i Execution time of datasets with 12 nodes utilized and 1 basepair permutations during search. j Throughput of datasets with 12 nodes utilized and 1 basepair permutations during search
