
Fig. 1.
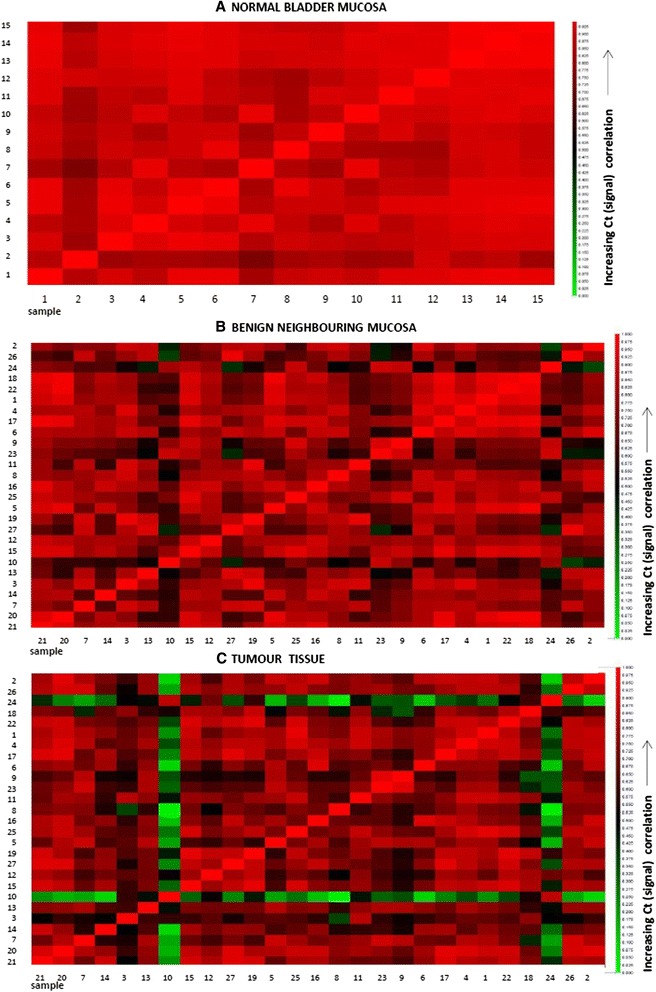
Gene expression signal correlation plots. The plots display the correlations between mRNA normalized gene expression levels in the normal control bladder tissue samples of 15 patients with BPH (a), benign tissue peripheral to the tumour (b) and tumour tissue (c) of 27 cystectomy patients, respectively. Pearson’s product moment correlation coefficients (r) for each pair of samples were calculated using DataAssist from Applied Biosystems. Each cell represents a different scatter plot, coloured to indicate the strength of the correlations between the samples. The higher the correlation between the gene expression levels in the two samples (the closer the correlation coefficient (r), is to 1), the colour moves towards brighter red. The poorer the correlation between the gene expression levels in the two samples (the closer r is to 0), the colour moves towards darker red and then green, indicating no correlation. All samples are correlated with each other for each of the selected genes