
Fig. 6.
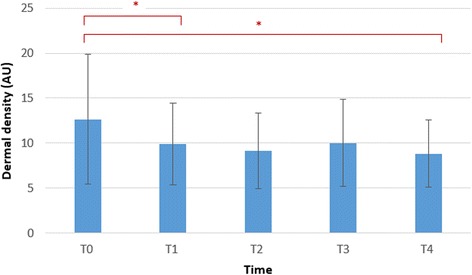
Bar chart showing the data distribution summaries of the dermal density at the different time points. *p < 0.05. Bar chart showing the mean and the error bar represents the standard deviations. T0 baseline measurement, T1 5 min after application, T2 30 min after application, T3 1 h after application, T4 2 h after application, AU arbitrary units