Fig. 5.

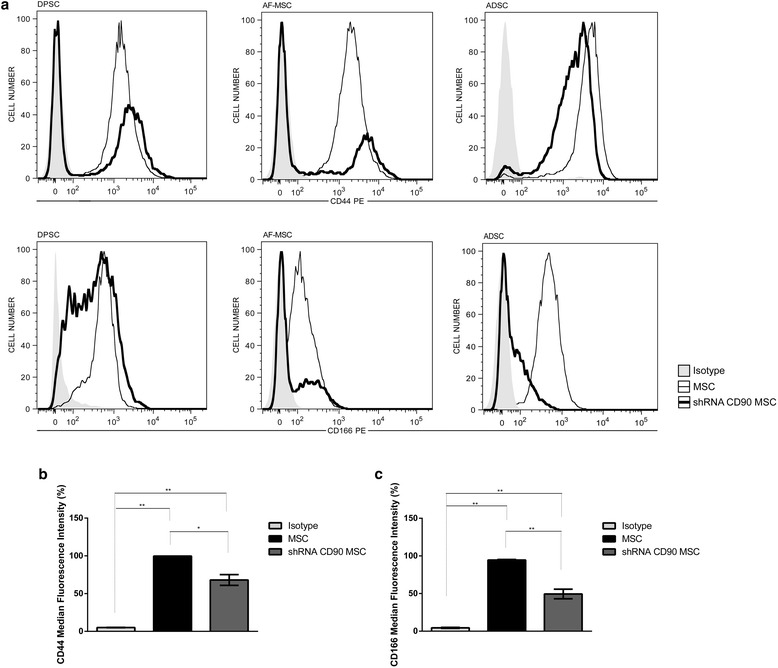
Reduction of CD90 expression leads to a reduction in the expression of CD44 and CD166 in mesenchymal stromal cells (MSCs). a MSCs (slim line) and shRNA CD90 MSCs (thick line) were analysed by flow cytometry to evaluate their expression of CD44 and CD166. The results showed a significant reduction of CD44 and CD166 expression in shRNA CD90 MSCs from different tissue sources. An isotype control (shaded histogram) was used to establish the boundary between negative and positive fluorescent regions. Median fluorescence intensities (MFI) of b CD44 and c CD166 markers on MSCs are shown (MFI = MFI marker – MFI isotype); n = 7; *p < 0.05. ADSC adipose tissue mesenchymal stromal cell, AF-MSC amniotic fluid mesenchymal stromal cell, DPSC dental pulp mesenchymal stromal cell, sh short hairpin
