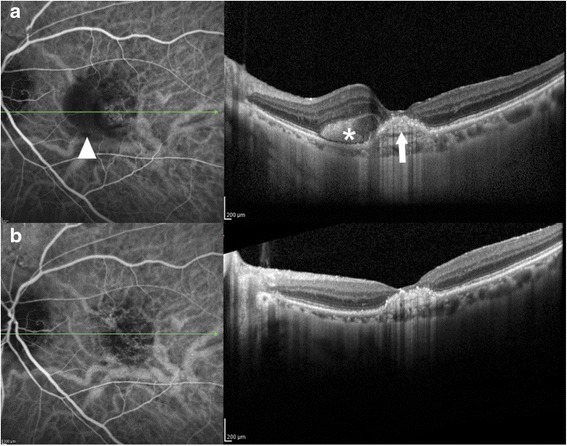
Fig. 2.

ICG angiogram with correlated OCT study in a previously treated eye in the PEARL 2 Study (12 2.0 mg ranibizumab + 12 1.0 mg ranibizumab) with additional bevacizumab intravitreal injections prior to entry into the EPIC study. a. Baseline EPIC Study images. ICG angiogram shows hypofluorescence (see arrowhead) in the area of the subretinal hyperreflective material and the central RPED. OCT shows a central RPED (arrow) with nasal subretinal hyperreflective material (asterisk). b. EPIC Month 6 imaging. ICG angiogram shows decrease in the area of hypofluorescence. OCT shows resolution of the subretinal hyperreflective material and decrease in the RPED. Visual acuity improved from 20/160 to 20/63 (+30 letters)
