Chart 1.

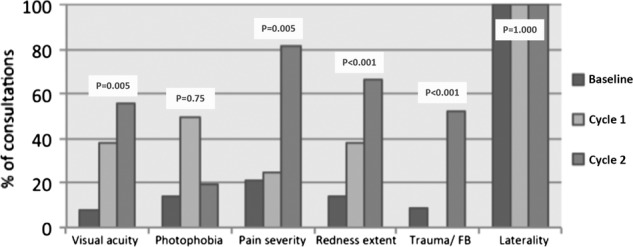
Percentage of consultations in which each red-flag feature was assessed P-values represent statistical significance between baseline values and values of data collected after two improvement cycles (at 24 weeks)

Percentage of consultations in which each red-flag feature was assessed P-values represent statistical significance between baseline values and values of data collected after two improvement cycles (at 24 weeks)