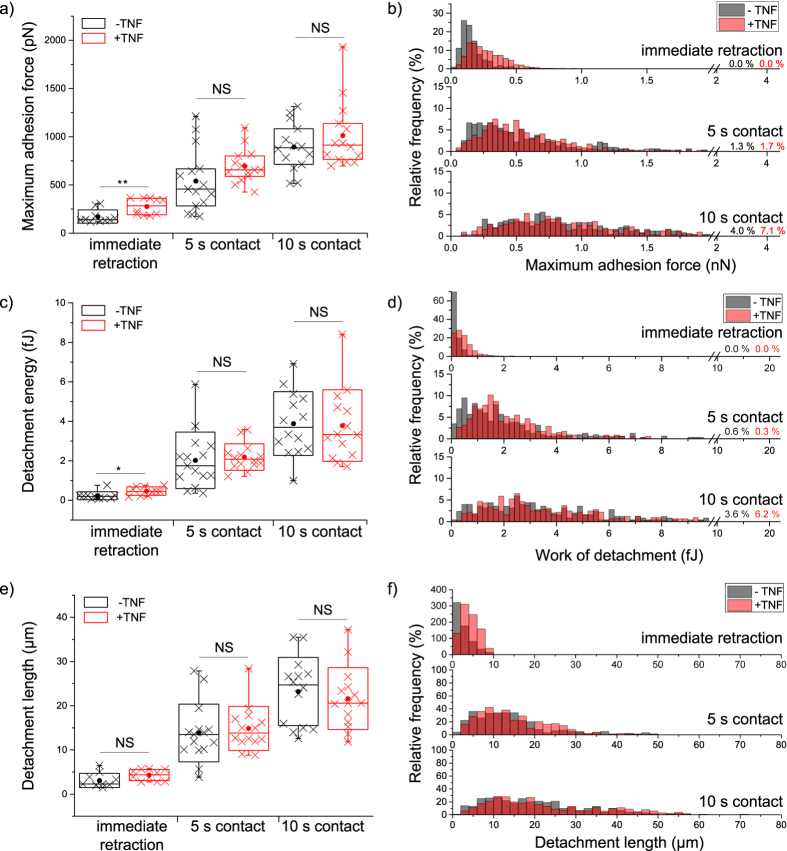
Figure 2. Influence of TNF on the adhesion of single Jurkat cells.
Untreated (−TNF, black) and TNF-treated (+TNF, red) cells are compared and >11 cells were analyzed for each treatment and contact time situation. Every cross in (a,c,e) represents the average value of >15 force-distance curves from a single cell, i.e. an independent experiment (Box: interquartile range; line in each box: median; dot: mean; whiskers: minimum/maximum; box plots were also calculated on the basis of averaged values from independent cells). Relative frequencies in (b,d,f) were calculated from all recorded force-distance curves. Whereas cell detachment forces (a,b) and work of detachment (c,d) are significantly influenced by TNF at the shortest contact time, the detachment length is not affected by TNF. Statistical significance was tested by applying a Student’s t-test to cell averages, i.e. independent experiments (**p < 0.01, *p < 0.05, NS: no significant difference at p < 0.05).

