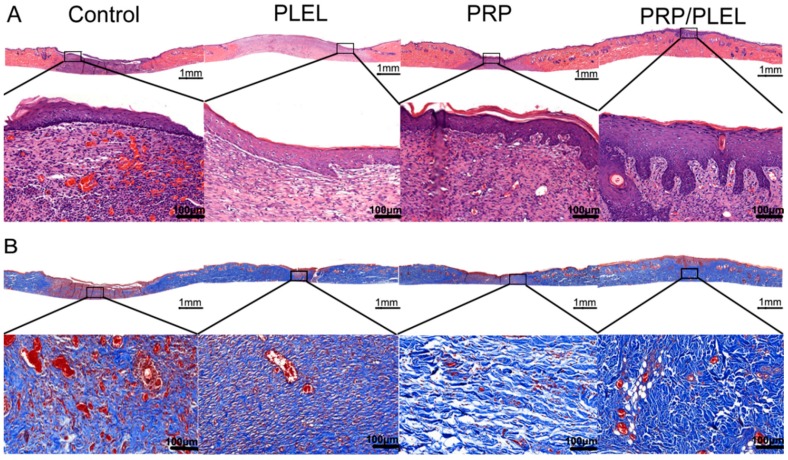
Figure 8.
Histological analysis of control, PLEL, PRP and PRP/PLEL group on day 14 post surgery. (A) Transmitted light images of HE-stained sections with low magnification (above, scale bar = 1 mm) and high magnification view of the region inside the box (below, scale bar = 100 μm); (B) Transmitted light images of Masson’s trichrome-stained sections, with low magnification (scale bar = 1 mm), and an enlarged view of the region inside the box (scale bar = 100 μm).

