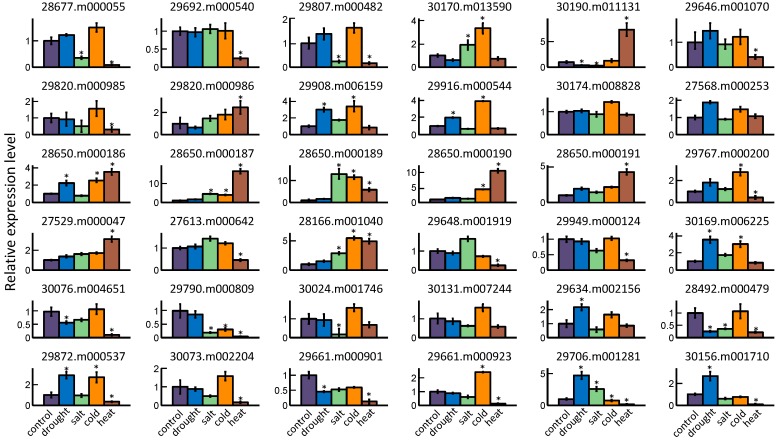
Figure 6.
Relative expression levels of 36 GRAS genes in different abiotic stress treatments. The two-week-old castor bean seedlings were subjected to various stress treatments including drought, salt, cold, and heat. The columns represent the expression levels of a gene, and the error bars show the standard error with three biological replicates. The expression level of control sample was normalized to 1. The asterisk above the columns indicates a significant change of expression level between stress treatment and control at p < 0.05.

