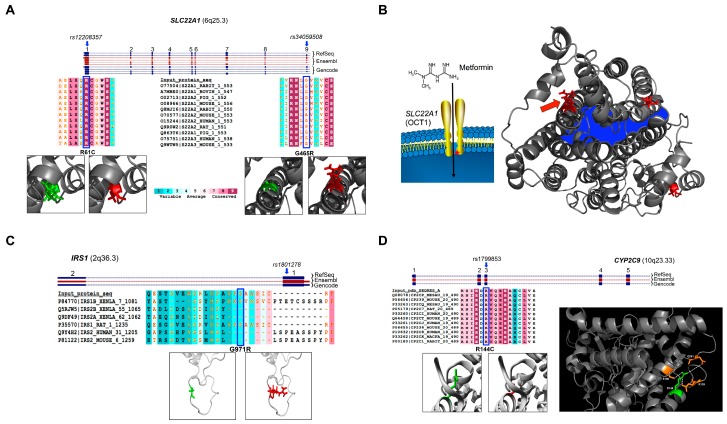
Figure 1.
SLC22A1 polymorphisms associated with metformin response. In the upper part, are schematically reported the genomic localizations of the SNPs analyzed in SLC22A1, IRS1 and CYP2C9 gene, in the panels (A), (C) and (D), respectively. RefSeq, Ensembl and GENCODE annotations are shown in different colors and are indicated in the Figure. The boxes indicate the exons and numbering is indicated above. The blue arrows indicate the genomic localization of the polymorphisms. In the lower part of panels (A), (C) and (D) are shown the 3D representations of amino acid changes corresponding to these SNPs. The canonical amino acid is reported in green and the mutated residue is shown in red. The evolutionary conservation score for each altered amino acid residue—according to Consurf software—is also shown. The specific amino acid is highlighted by a blue box; (B) on the left part, a schematic representation of the Oct1 protein in the cell membrane is shown. The red asterisk indicates the approximate position of the amino acid 465G, whose alteration is associated with reduced metformin responsiveness. On the right part of panel (B), the 3D protein structure of the entire Oct1 protein is shown. The inner portion of the channel is indicated in blue. Amino acid changes under evaluation are indicated in red (red arrow indicates G465R substitution); (D) on the right, the 3D protein structure of Cyp2c9 is shown, with the canonical R144 residue (in green) and three amino acids that are predicted to interact with it (in orange). Dashed white lines indicate the H-bonds among these residues.

