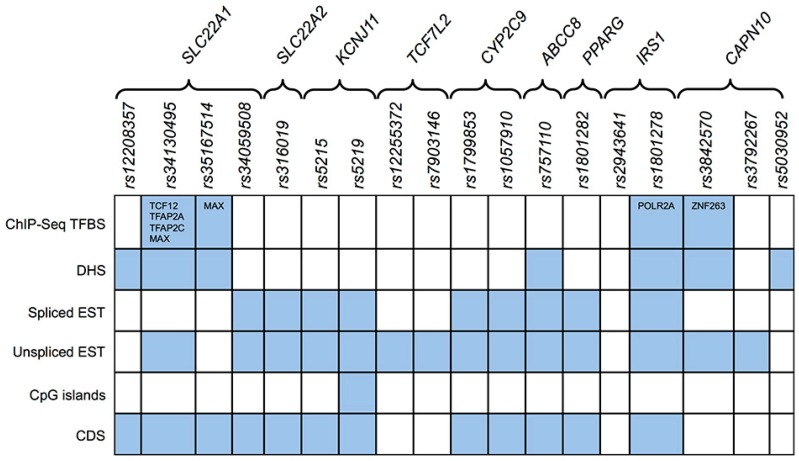
Figure 2.
SNPs in drug resistance genes map to different regulatory regions. The panel shows a summary of the genomic regulatory elements that surround the SNPs herein analyzed. The cells in light blue indicate the presence of the SNP within a given regulatory element or genomic feature, whereas white cells indicate that the SNP does not fall within any of the analyzed regions. In the light blue cells of Transcription Factors Binding Sites detected by ChIP-Seq (ChIP-Seq TFBS row), the transcription factors are indicated that have binding sites potentially affected by the presence of the SNP (columns); DHS (DNAse Hypersensitive Sites); EST (Expressed Sequence Tag); CDS (Coding Sequences).

