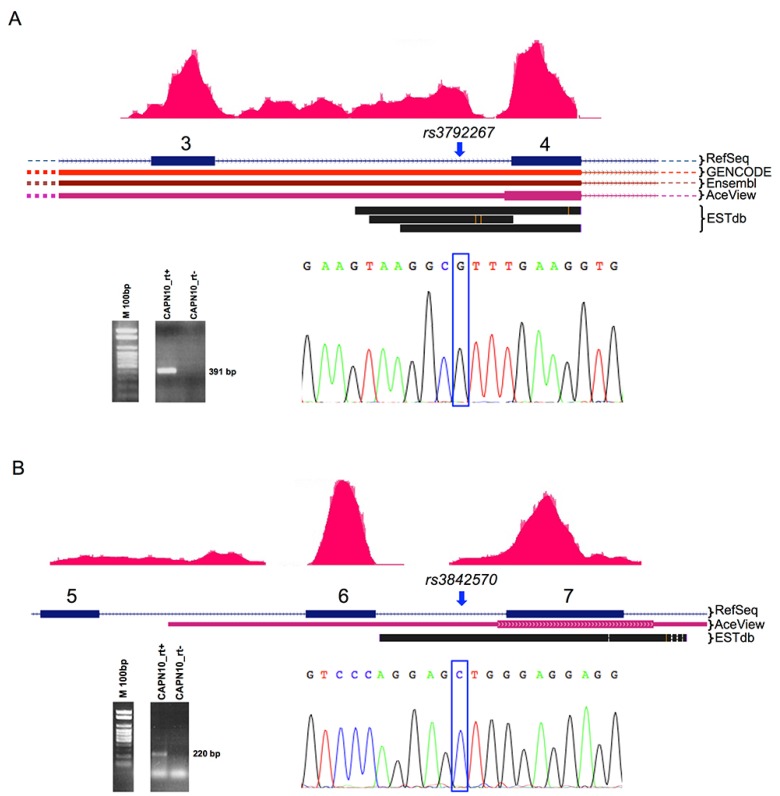
Figure 3.
Schematic representation of the newly identified transcripts within the CAPN10 gene locus. Genomic localization of the SNPs rs3842570 (A) and rs3792267 (B) in the CAPN10 gene are shown. In the upper part of each panel: approximate localization of the SNPs according to RefSeq, Ensembl, Aceview, GENCODE and ESTdb annotations (boxes indicate the exons, whose numbers are shown above). The blue arrows indicate the genomic localization of the polymorphisms. Red peaks on gene annotations represent the reads’ coverage from the RNA-Seq experiment carried out on the HEK293 cell line. Peaks are indicative of active gene transcription. Agarose gel electrophoresis pictures for RT+ (Reverse Transcriptase) and RT-PCR assays in the HEK293 cell line are also reported for each panel. Blue boxes in the electropherograms (Sanger sequencing output) indicate the polymorphic site, which falls within a transcribed region.

