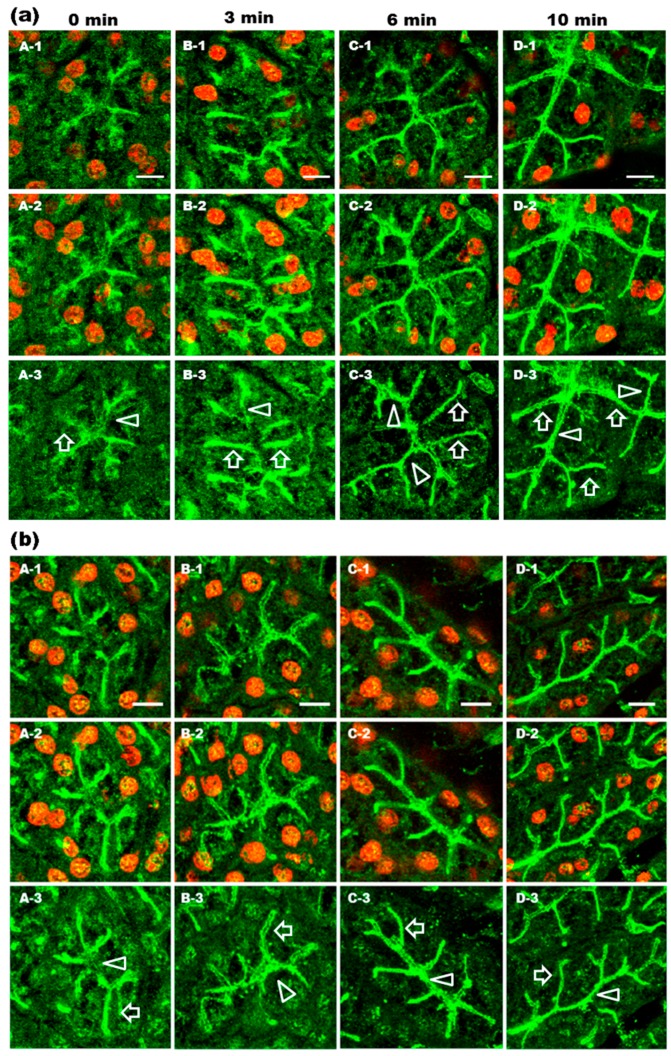
Figure 1.
Immunohistochemical analysis of aquaporin-5 (AQP5) and ganglioside GM1 distributions in rat parotid acinar cells after phenylephrine injection. Parotid glands were obtained from rats 0 (A), 3 (B), 6 (C), and 10 (D) min after phenylephrine (0.25 mg/kg) injection. Tissue sections were fixed in ethanol followed by incubation with anti-AQP5 (a) and anti-GM1 (b) antibodies. Alexa-488 was used to visualize AQP5 and GM1. Propidium iodide (PI) was used to stain nuclei. One section is presented in each single image (−1). Sixteen consecutive images produced by a confocal microscope were projected to generate a single image (−2). To get clear visualization of AQP5 localization in acinar cells, the 568 nm laser was turned off (−3). Arrow heads and arrows indicate apical plasma membrane (APM) and lateral plasma membrane (LPM), respectively. Scale bars: 10 µm.

