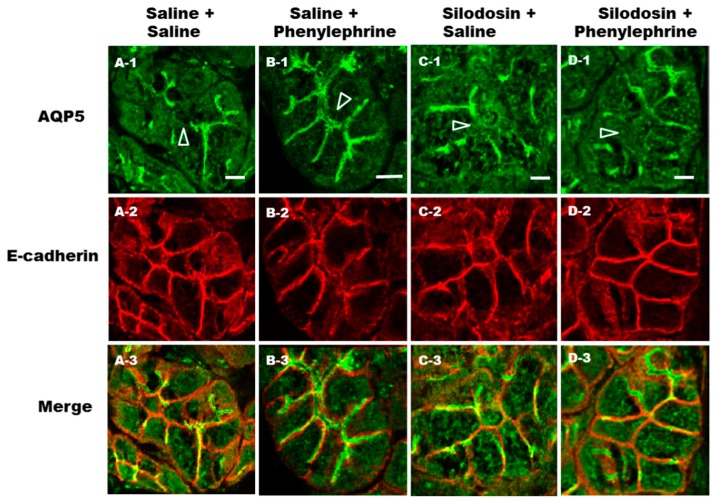
Figure 4.
Immunohistochemical analysis of AQP5 and E-cadherin distributions in rat parotid acinar cells after phenylephrine and silodosin administration. Rats were treated with silodosin (a daily dose of 1 mg/kg p.o.) (C and D) or saline (A and B) once daily for 1 week. Subsequently, phenylephrine (0.25 mg/kg) (B and D) or saline (A and C) was intravenously injected and parotid glands were subjected to immunohistochemical analysis with anti-AQP5 and anti-E-cadherin antibodies. Secondary antibodies coupled to Alexa-488 or 568 were used to visualize AQP5 (A-1 to D-1) and E-cadherin (A-2 to D-2), respectively. Arrow heads indicate APM. Scale bars: 10 µm.

