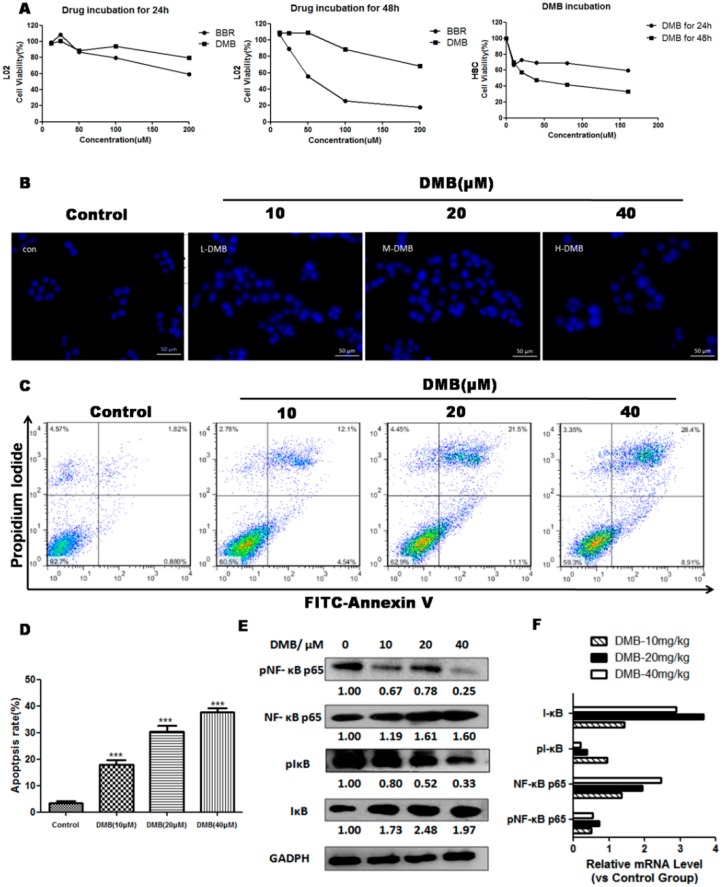
Figure 6.
(A) After serum-starvation for 24 h, L02 and HSC-T6 cells were exposed to DMB or BBR for 24 and 48 h, and cell viability was then assayed using the 3-(4,5-dimethylthiazol-2-yl)-2,5-diphenyltetrazolium bromide (MTT) method; (B) Cell morphology under fluorescence microscopy by Hoechst 33258 staining in HSCs incubated with DMEM or DMB for 48 h. Panels represent the control group and the groups exposed to 10, 20, and 40 µM of DMB, respectively. The DMB-treated HSC-T6 cells exhibited morphological changes of nuclei (C) Flow cytometry analysis by Annexin V-Fluorescein isothiocyanate/propidium iodide (FITC/PI) double-staining in HSC-T6 cells incubated with DMEM or difference doses of DMB (10, 20, and 40 µM) for 48 h; (D) The percentages of cells at different stages (viable, apoptotic, and necrotic) in HSCs incubated with DMEM or DMB for 48 h; (E) Western blot analysis of apoptosis-related proteins in HSCs incubated with DMEM or DMB (10, 20, and 40 µM) for 48 h. The level of p-NF-κB P65 was normalized to its unphosphorylated form, while the levels of IκBα, and p-IκBα were normalized to GAPDH; (F) qPCR analysis of related gene levels in DMB (10, 20, 40 mg/kg) treated HSCs, compared to untreated HSCs. Representative blots were from three independent experiments. Values represent means ± SD (n = 3). *** p <0.001 compared to the control group.

