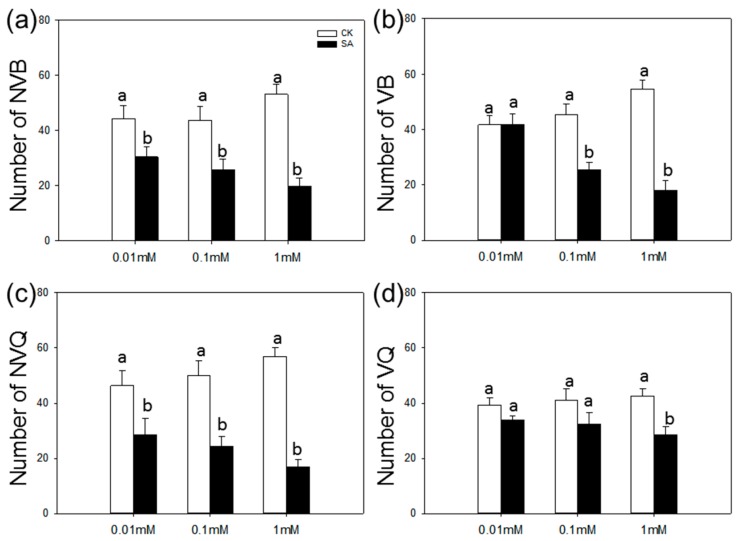
Figure 2.
Choice test of B. tabaci on SA-treated vs. control plants. Choice test of nonviruliferous B (a); viruliferous B (b); nonviruliferous Q (c); and viruliferous Q (d) as indicated by numbers per plant. Three concentrations of SA were used: 0.01, 0.1, and 1 mM. Values are means ± SE (n = 9). Different lowercase letters indicate significant differences between control plants and SA-treated plants (LSD test at p < 0.05).

