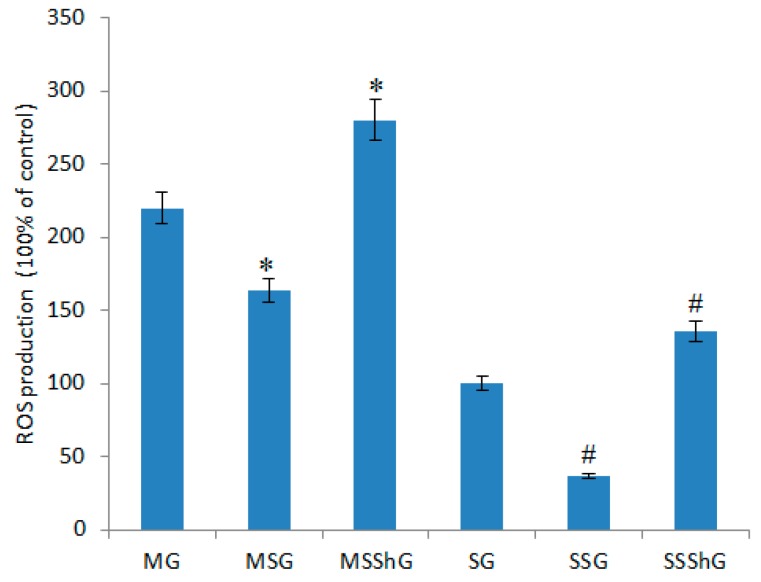
Figure 3.
ROS production in different cells. Among 16 mice, eight mice were used to create RIRI models as a model group and eight mice were used as a sham group. Renal progenitor cells were isolated from the kidney cortex of RIRI model and sham mice after 16-h surgery. For the kidney cells isolated from eight model mice, they were further subdivided into three groups based on different treatment options (model group (MG); STC-1 expression group (MSG), the mice were transfected with STC-1 gene to overexpress STC-1; and STC-1 shRNA group (MSShG), the mice were transfected with STC-1 shRNA to knockdown STC-1). In the same way, the kidney cells from eight sham mice were subdivided into another three groups based on different treatment options sham groups (sham group (SG); STC-1 expression group (SSG), the mice were transfected with STC-1 gene to overexpress STC-1; and STC-1 shRNA group (SSShG), the mice were transfected with STC-1 shRNA to knockdown STC-1). The ROS levels were measured from all the cells cultured for 24 h. All data were presented as the mean values ± S.D. * p < 0.05 via a model group and # p < 0.05 via a sham group.

