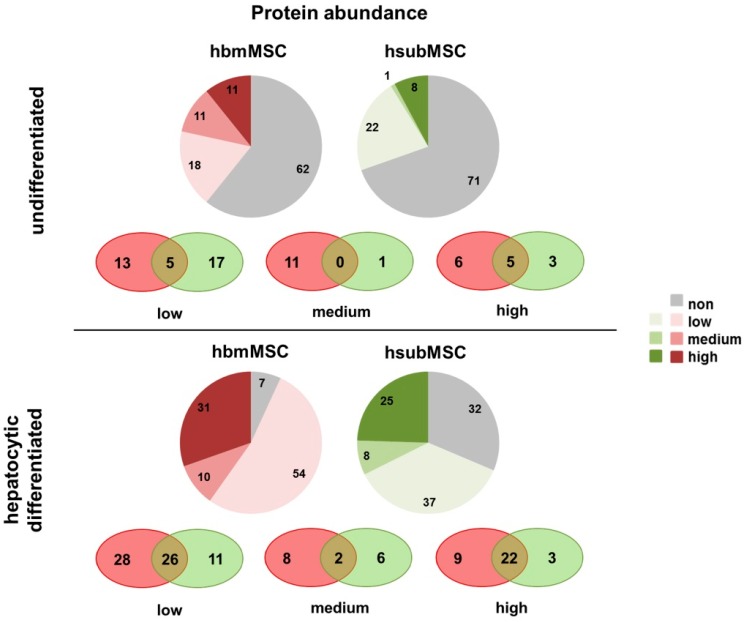
Figure 3.
Graphical illustration of proteins secreted by undifferentiated (top) and differentiated (bottom) hbmMSC (red) and hsubMSC (green). The pie charts represent the number of proteins arbitrarily classified as low, medium and high secretion. The number of proteins not detected is shown in grey. Proteins secreted both by hbmMSC and hsubMSC are shown as the intersection of proteins secreted at low, medium and high abundance. Estimates were deduced from three independent experiments using MSC from three different donors each.

