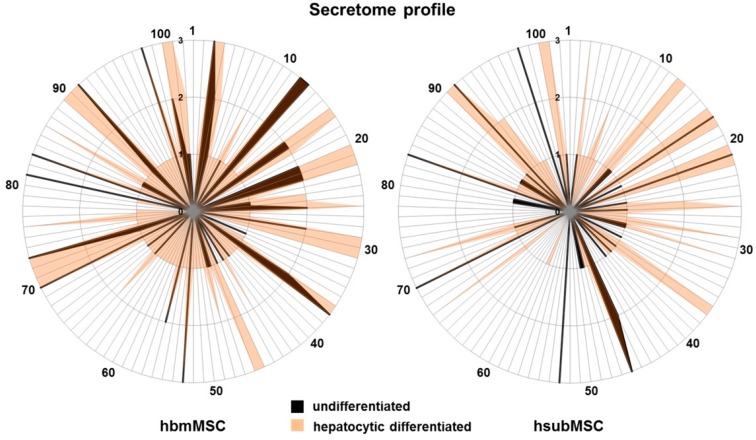
Figure 4.
Graphical nets of proteins secreted by undifferentiated (black lines) and differentiated (orange lines) hbmMSC (left) and hsubMSC (right) in low (1), medium (2) and high (3) abundance as taken from results shown in Figure 3. Individual proteins are numbered consecutively from 1 to 102 as shown at the edge of the radii. A comprehensive list of numbers and corresponding proteins is given in Table S5.

