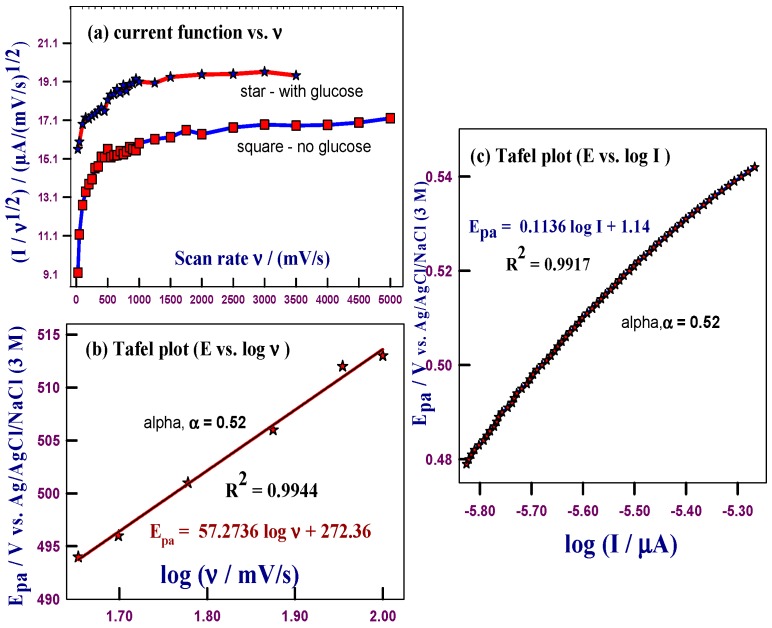
Figure 4.
(a) Variations of the peak current function (I/ν1/2) vs. ν for the oxidation of glucose; (b) Dependence of the peak potential, Epa on log ν; and (c) Tafel plot derived from the potentiodynamic polarization curve (I–E) at 5 mV/s for a HCNiO/GC electrode in 0.05 M NaOH in the presence of 1 mM glucose.

