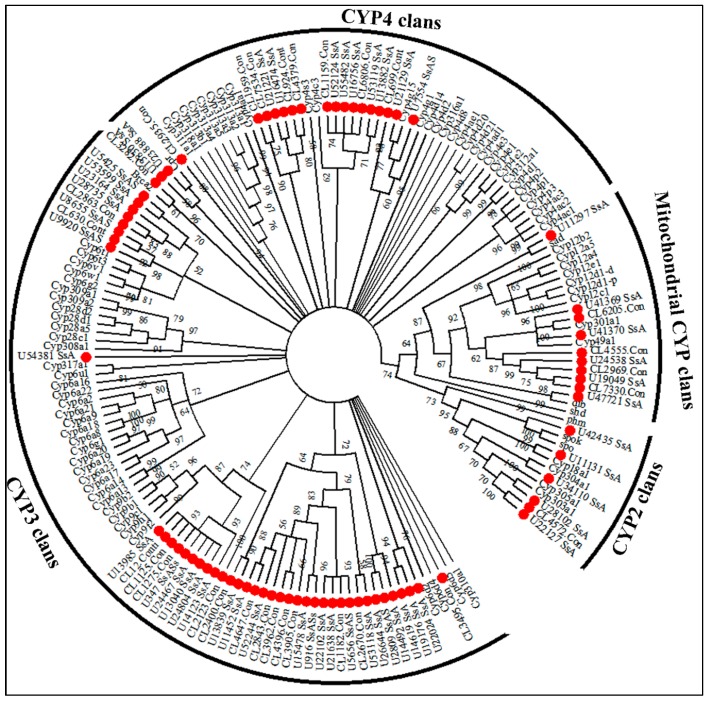
Figure 5.
The phylogenetic analysis of sequences encoding P450s from S. shirakii and D. melanogaster. Branch numbers represent bootstrap values (1000 replicates). The 79 S. shirakii unigenes encoding P450s are marked with filled red circles. The sequences used to reconstruct the maximum likelihood (ML) tree are available as S1 Data.

