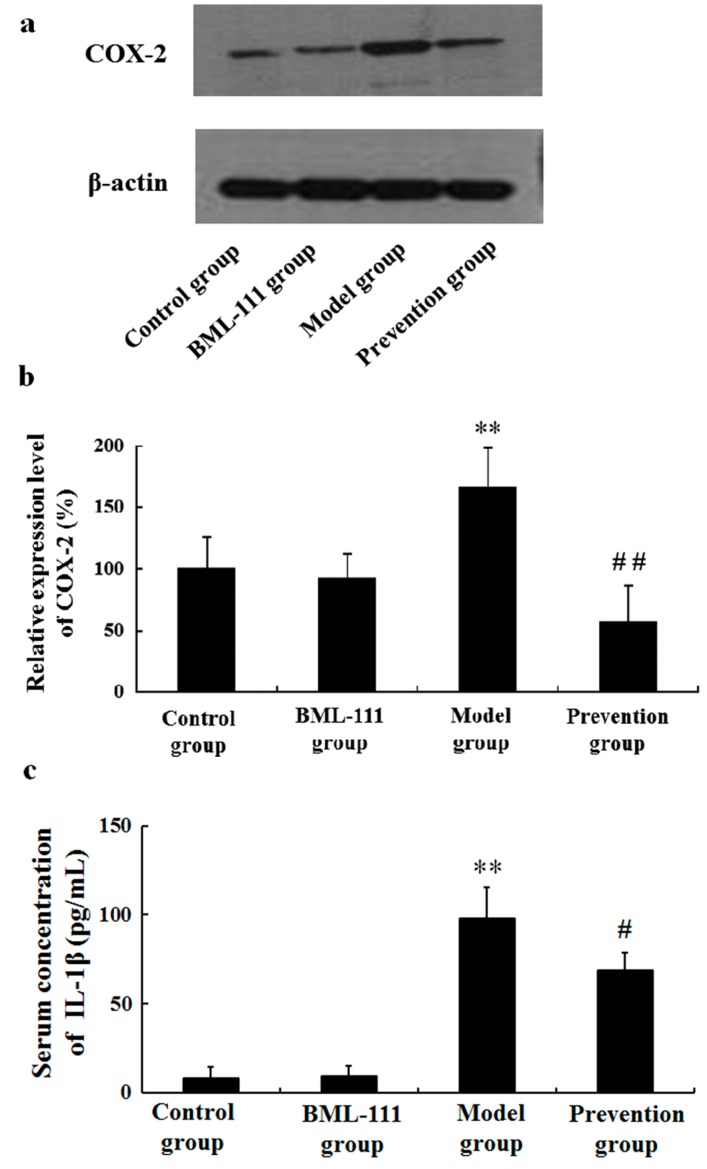
Figure 4.
BML-111 inhibited LPS/d-GalN induced COX-2 and IL-1β. (a) Western blot analysis of COX-2. The COX-2 band (72 kDa) and the β-actin band (43 kDa) are indicated; (b) blots obtained from several experiments were analyzed using densitometry, and the densitometric values are shown as means ± SD (n = 3); (c) The levels of IL-1β in serum were measured via ELISA. ** p < 0.01 compared with the control group, # p < 0.05, ## p < 0.01 compared with the model group (n = 6).

