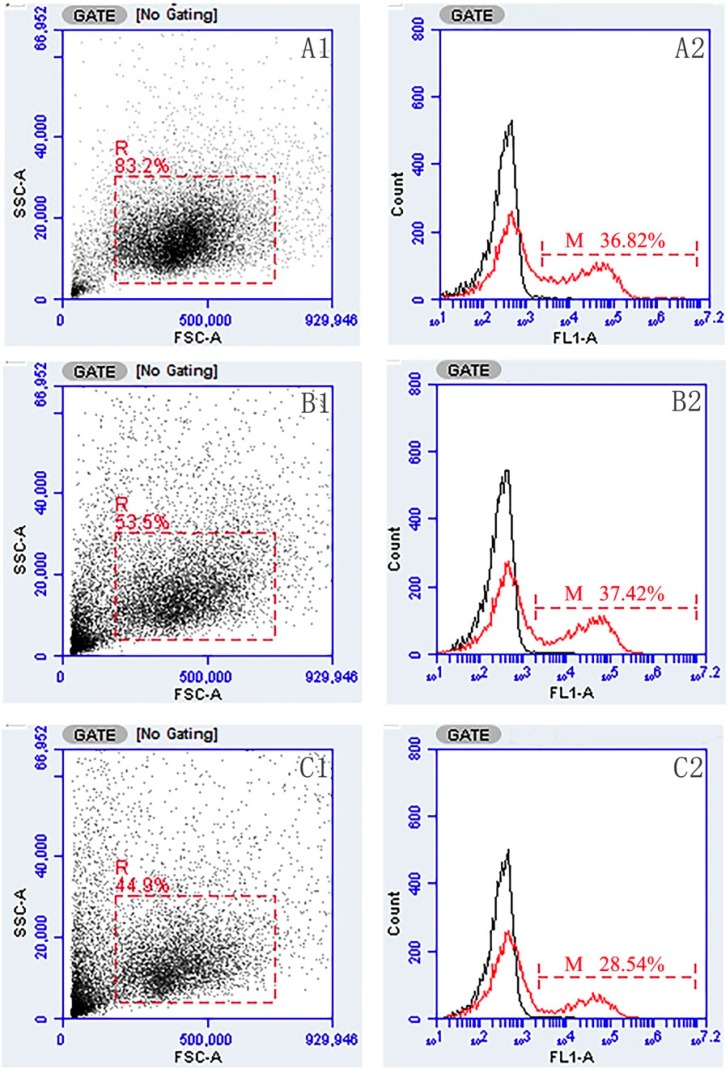
Figure 3.
Flow cytometric analysis of lymphocytes reacted with MAb 2D8. A1, B1 and C1 represented lymphocytes in blood, spleen, and pronephros gated (R) on a forward scatter (FSC) versus side scatter (SSC) dot plot, respectively; A2, B2 and C2, rOmpC-injected fish, combined (smoothed) Fluorescein isothiocyanate (FITC) fluorescence histogram of gated lymphocytes (R) showing the percentages of sIg+ lymphocytes (scale of M) in blood, spleen, and pronephros at week 4 after immunization, respectively.

