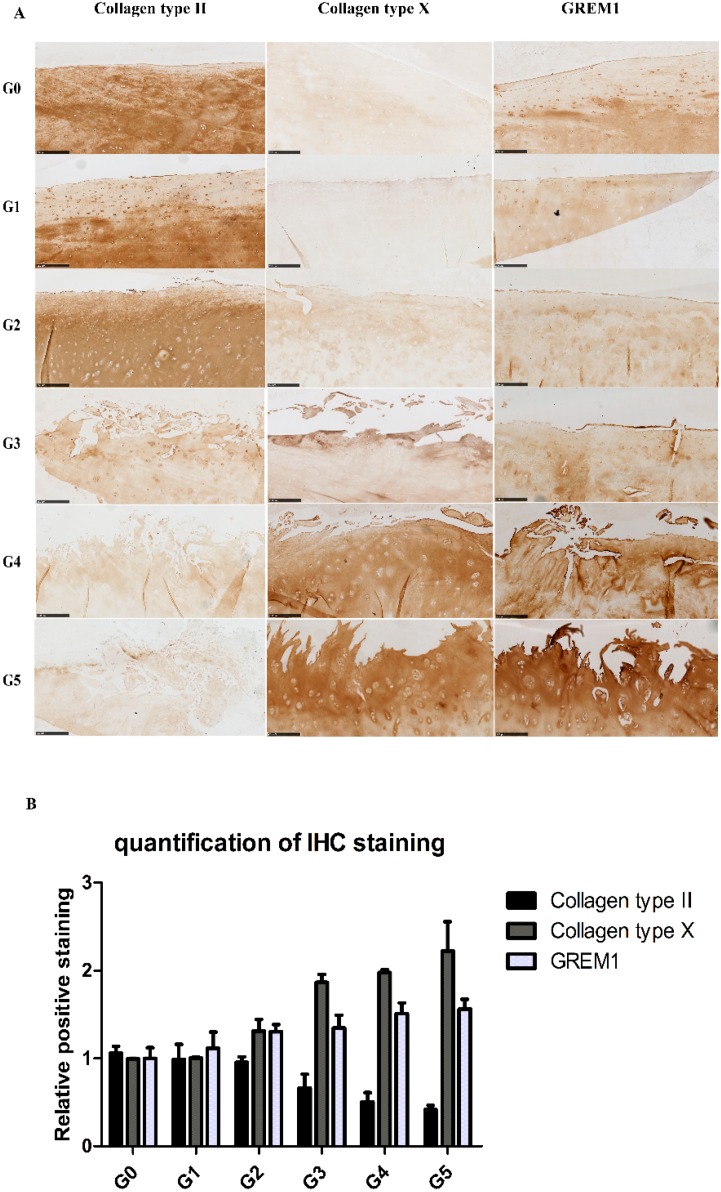
Figure 2.
The protein expression of collagen type II, collagen type X and GREM1 was visualized by IHC (scale bar 250 μm). (A) Representative pictures are shown. Images were taken using the Nanozoomer. G0, G1, G2, G3, G4, G5 = Grade 0, Grade 1, Grade 2, Grade 3, Grade 4, Grade 5; (B) Quantification of positive staining was performed by ImageJ software (Wayne Rasband, Bethesda, MD, USA).

