Table 2.
Expression of hypertrophy-related genes in OA cartilage and correlation with the severity of OA (n = 12). RT-PCR was performed to assess gene expression. Pearson correlation was used to examine the correlation between gene expression and the severity of OA. Y axis = 0, indicated by #, means this gene is under the detection level. p < 0.05 was considered statistically correlated. ns: no correlation; * p < 0.05, ** p < 0.01: significant correlation.
| Gene Name | Protein Function | Gene Expression Trend | Correlation between Gene Expression and OA Severity | Correlation Significant | |
|---|---|---|---|---|---|
| RUNX2 | Promotes chondrocyte hypertrophy and bone formation | 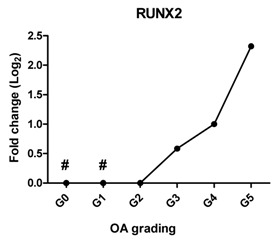 |
0.908 | 0.012 | * |
| COL10A1 | The marker of hypertrophic chondrocytes, regulates matrix mineralization | 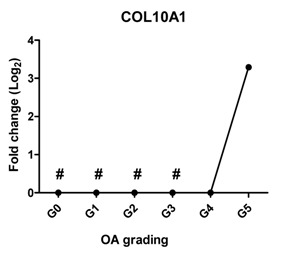 |
0.705 | 0.118 | ns |
| IHH | Promotes chondrocyte hypertrophy and bone formation | 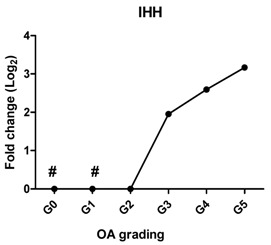 |
0.961 | 0.002 | ** |
| AXIN2 | Induces chondrogenesis at low level while inhibits chondrogenic differentiation at high level | 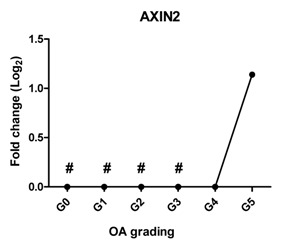 |
0.827 | 0.052 | ns |
| BMP2 | Stimulates chondrogenesis and increases cartilage matrix turnover | 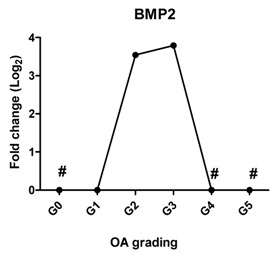 |
−0.007 | 0.990 | ns |
