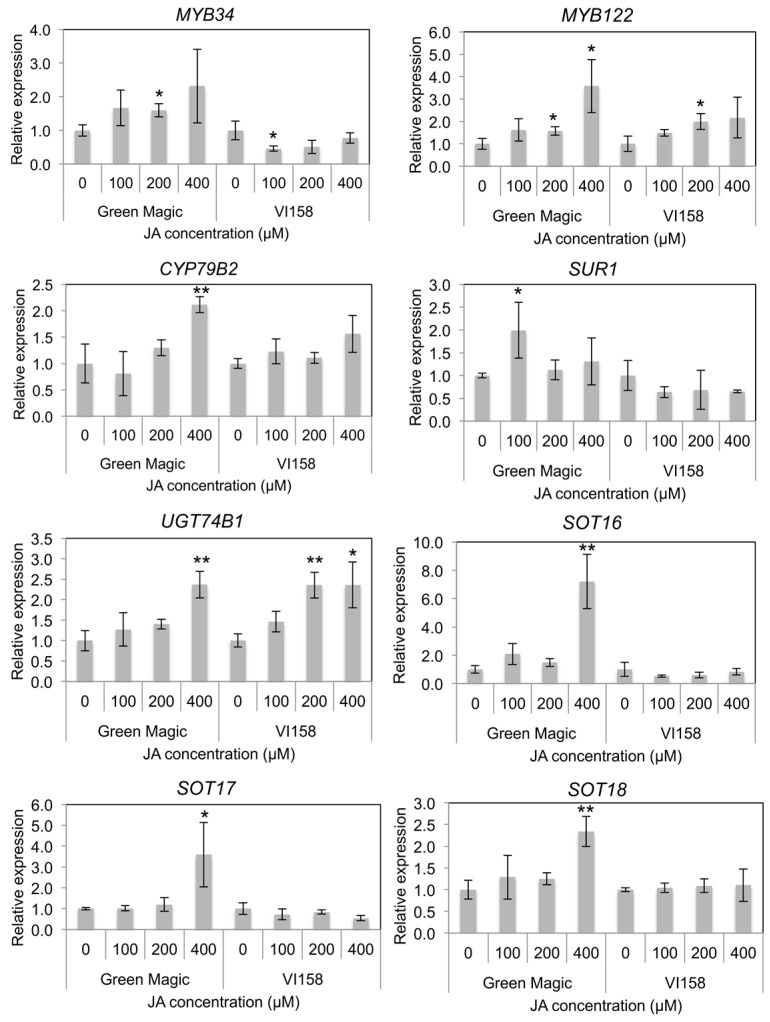
Figure 3.
Histograms representing changes in relative transcript abundance of transcription factors and glucosinolate core structure synthesis genes for different cultivar/treatment combinations. Asterisks indicate significant differences from the control within the same cultivar determined by Student’s t-test at p = 0.05 (*) and p = 0.01 (**), respectively.

