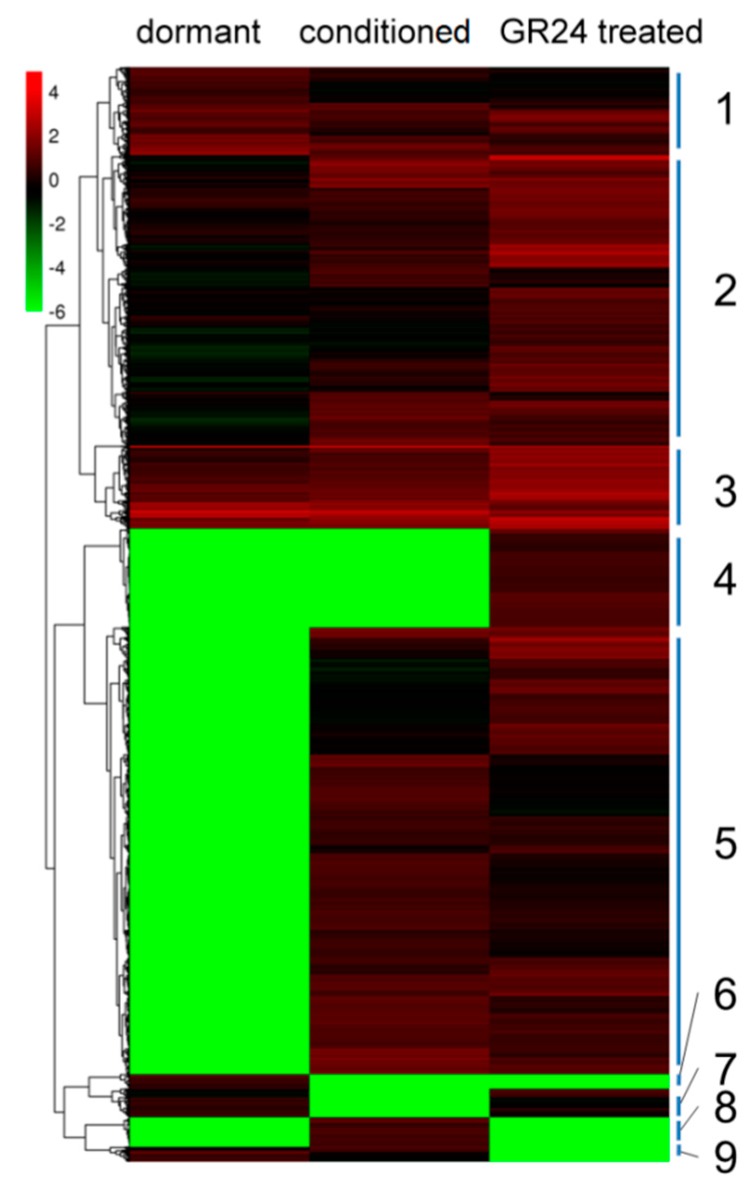
Figure 6.
Heat map from hierarchical clustering of differentially expressed genes during P. aegyptiaca seed germination. Expression changes and cluster analysis of 5324 genes that were differentially expressed between any two of the three samples. Each row represents a differentially expressed gene (DEG), whereas each column represents a sample. Changes in expression levels are shown in color scales with saturation at >2.0-fold changes. Green and red color gradients indicate a decrease and increase in transcript abundance, respectively.

