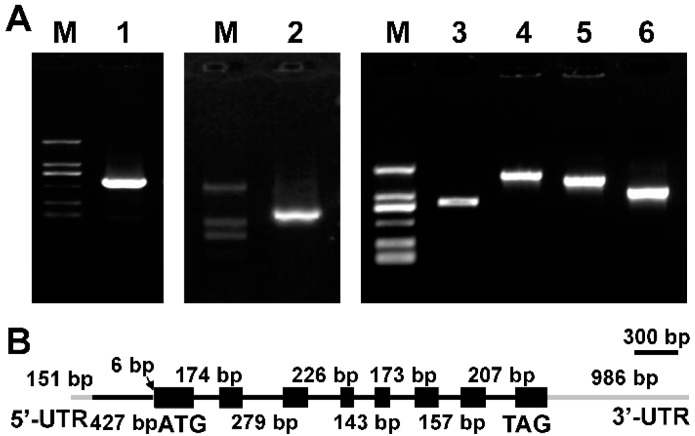
Figure 1.
(A) Electrophoresis profiles of Δ9 FAD 5′-RACE and 3′-RACE product from Myrmecia incisa. M: D2000 marker; Lane 1: 5′-ends of Δ9 fatty acid desaturase (FAD); Lane 2: 3′-ends of Δ9 FAD; Lanes 3, 4, 5 and 6: the amplification products of Δ9 FAD using DNA as the template; (B) Schematic illustration of the gene structure of MiΔ9FAD. Black boxes: extrons; black lines: introns; gray lines: untranslated region (UTR).

