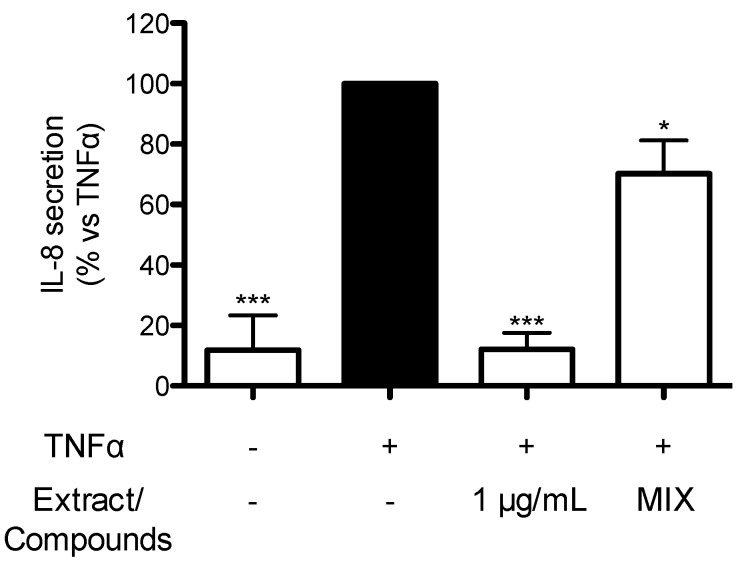
Figure 4.
Effect of the mixture of pure compounds on TNFα-induced IL-8 release in AGS cells. Graphs show the means ± s.d. of at least three experiments performed in triplicates. Statistical analysis: one-way analysis of variance (ANOVA), followed by Bonferroni as post-hoc test. * p < 0.05, *** p < 0.0001 versus TNFα alone. EGCG was used as reference inhibitor of IL-8 release (>70% inhibition at 20 μM).

