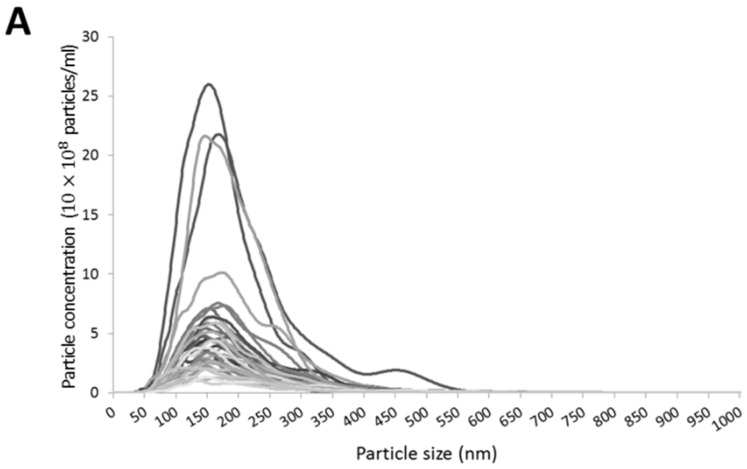
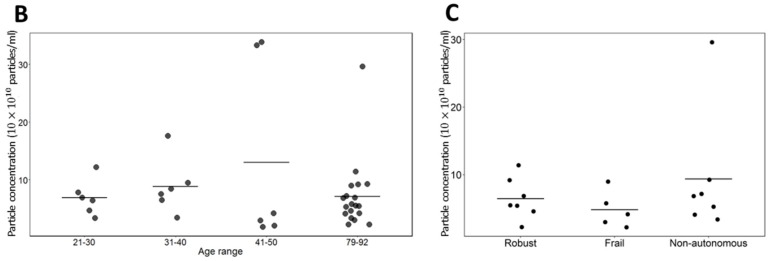
Figure 2.
Nanoparticle tracking analysis (NTA) of extracellular vesicles (EVs). Particle size and EV concentration were measured by NTA. (A) Size distribution of EVs. Each line represents one sample. Despite the particle concentration difference, all samples have a similar size distribution—they are enriched in small EVs (50–300 nm); (B) EV concentration of different age ranges were compared and samples from elder people (79–92 years) do not show an increased EV number; and (C) among elder individuals, the frailty status does also not alter EV concentration. In figures (B) and (C) each dot shows the EV concentration of a subject and the line represents the average value of the group.


