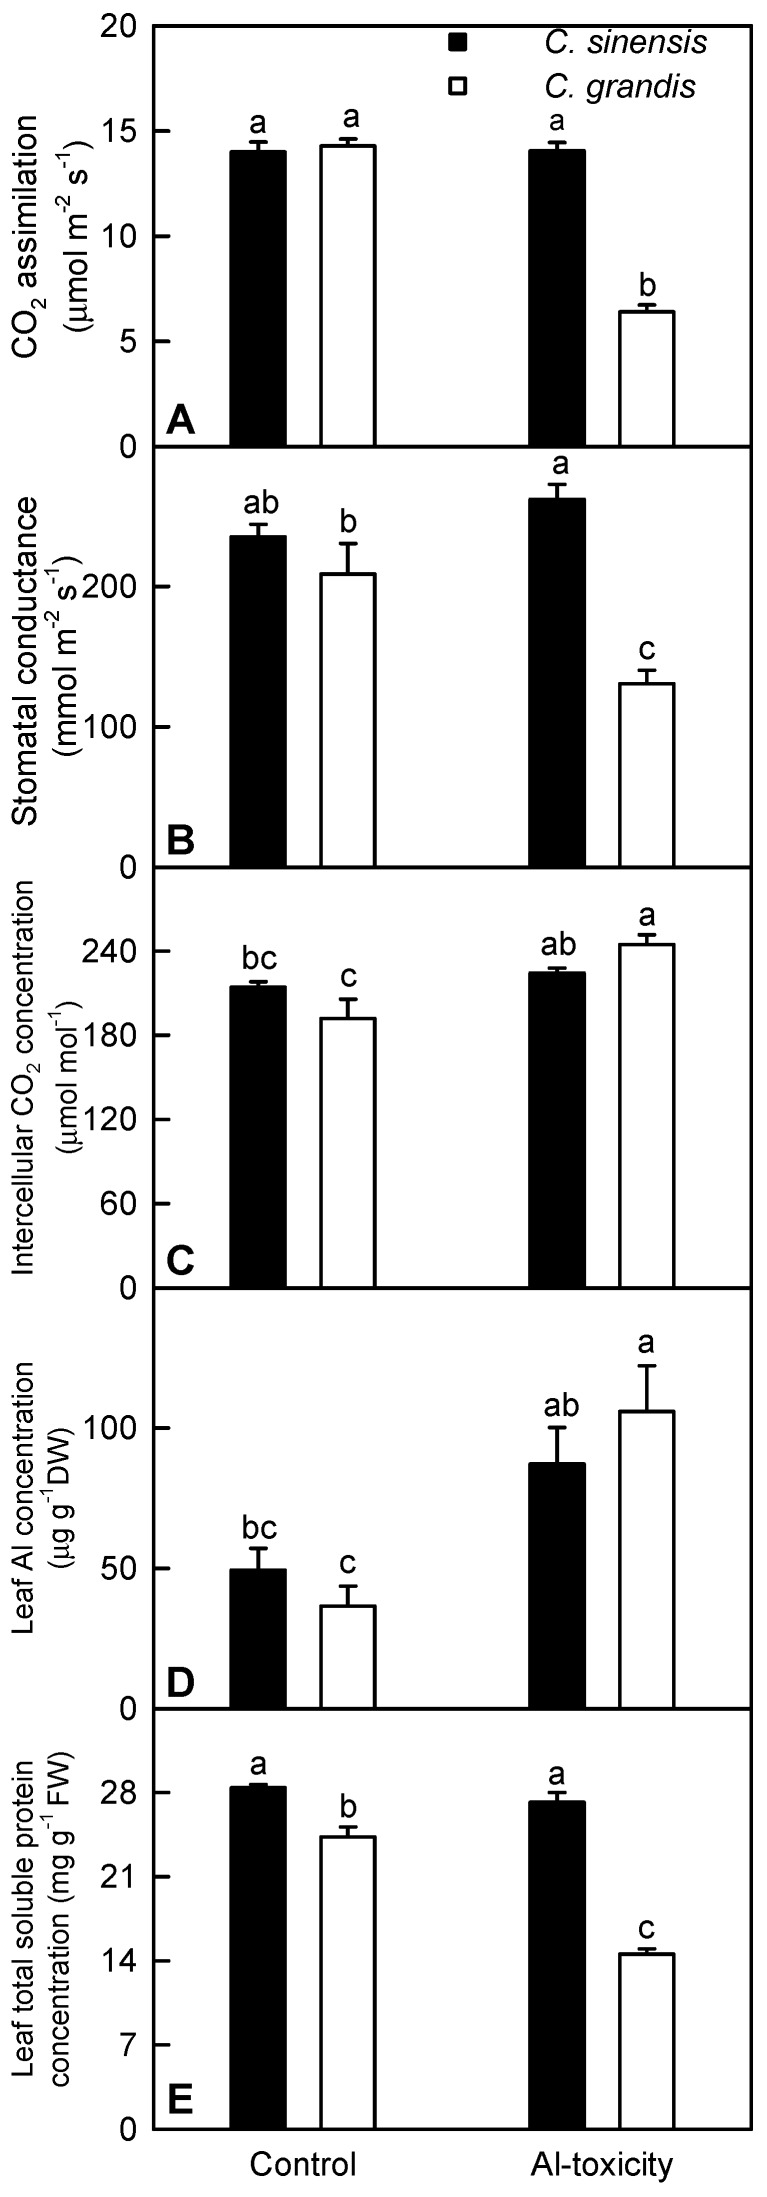
Figure 1.
Effects of Al toxicity on leaf CO2 assimilation (A); stomatal conductance (B); intercellular CO2 concentration (C); Al (D) and total soluble protein (E) concentrations. Bars represent the means ± standard error SE (n = 5). DW: dry weight; FW: fresh weight. Differences among four treatment combinations (two species × two Al) were analyzed by two-way analysis of variance. Means were separated by Duncan’s new multiple range test. Different letters above the bars indicate a significant difference at p < 0.05.

