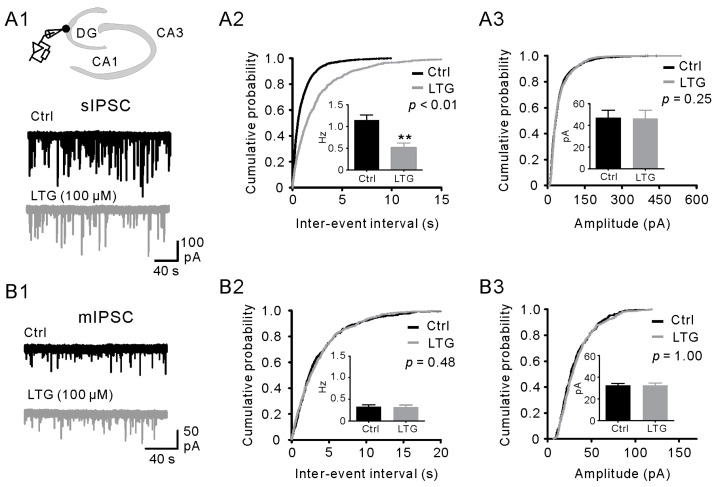
Figure 3.
LTG decreased the frequency of spontaneous IPSCs (sIPSCs), but not miniature IPSCs (mIPSCs) in GCs. (A1) (Top) Recording configuration: Whole-cell voltage-clamp recordings from a GC at −70 mV in the DG. CA1, cornus ammonis region 1; (Middle and bottom) Traces of sIPSCs recorded before (black) and after (gray) LTG (100 µM) application; (A2,A3) Cumulative distributions of sIPSC inter-event intervals (A2) and amplitudes (A3) from the control (black; n = 10) and LTG (gray; n = 10). Insets show the bar graph summaries of the averages. ** p < 0.01; (B1) (Top) Traces of mIPSCs recorded at −70 mV in the control (black); (Bottom) Events in the presence of LTG (100 µM) application (gray); (B2,B3) Cumulative distributions of mIPSC inter-event intervals (B2) and amplitude (B3) in the control (black, n = 10) and LTG (gray, n = 10). Insets show the bar graph summaries of the averages.

