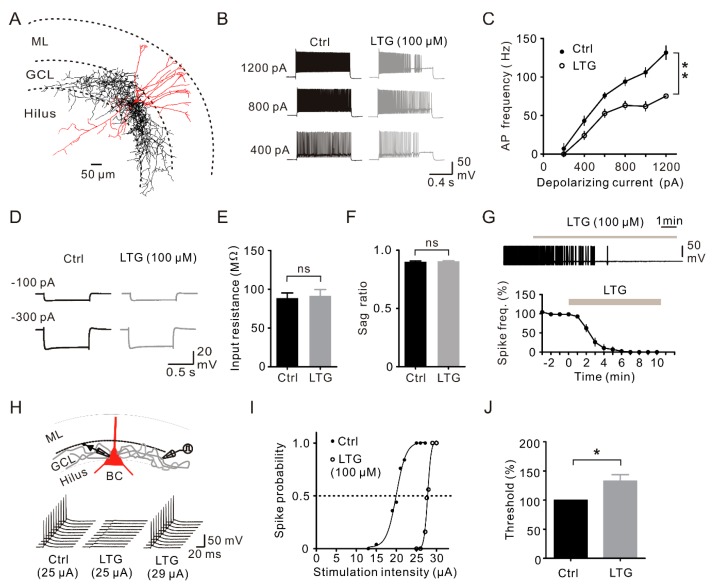
Figure 4.
LTG suppressed BC excitability. (A) Reconstruction of a biocytin-filled BC whose axon arborized in the GCL. Soma and dendrites are shown in red, and axons are in black; (B) Exemplar traces of APs evoked by 1-s depolarizing current pulses (400, 800, 1200 pA) in the presence of synaptic blockers. Black traces, control; gray traces, LTG. Cells were held at −70 mV by holding the current adjustment throughout the experiment; (C) Mean AP frequency plotted against the injected current (n = 10). ** p < 0.01; (D) Exemplar voltage traces recorded during 1-s hyperpolarizing current pulses (−100 pA and −300 pA, respectively) under whole-cell current-clamp before (black traces) and after 100 µM LTG (gray traces) application; (E,F) Summary bar graphs of the effect of 100 µM LTG on (E) input resistance and (F) the sag ratio (voltage change at the end of the 1-s pulse/maximal voltage change or −300 pA current injection) with no significant difference under control and LTG conditions (n = 9). ns, no significance; (G) Summary of the plot of the spontaneous spike frequency against time illustrating the effect of 100 µM LTG (n = 10). BCs were slightly depolarized to fire persistent APs by sustained somatic current injection (100–200 pA); (H) (Top) A stimulating electrode (monopolar glass pipette) placed in the GCL at a distance of 100–300 µm from the recorded BC; (Bottom) 10 consecutive spikes of APs in the control (stimulus intensity 25 µA) (left), in the presence of 100 µM LTG at the same stimulus intensity (middle) and in the presence of 100 µM LTG after the increase in stimulation intensity (right, 29 µA); (I) Spike probability plotted against stimulus intensity in the control (black) and after LTG (gray). The dashed line indicates that LTG increases the threshold for spike initiation (current leading to 50% successes); (J) Summary of the LTG effect on the AP threshold. Data were normalized to the control from five BCs. * p < 0.05.

