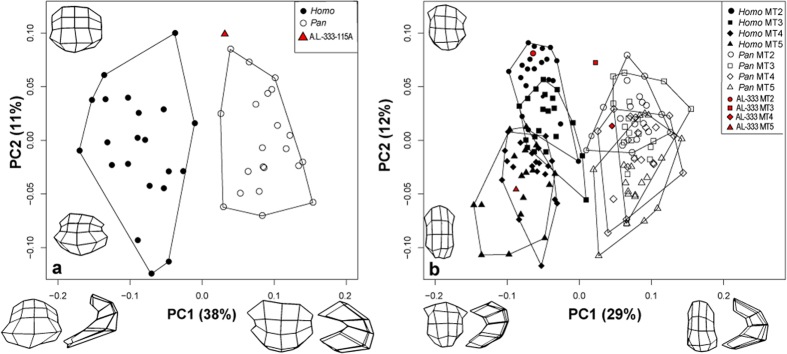
Figure 4. PCA scatterplot of PC1 vs. PC2 for MT1 (left) and MT2–MT5 (right).
PC1 tracks dorso-plantar orientation of the MT head whereas PC2 tracks mediolateral MT head breadth. High negative PC scores indicate dorsally oriented MT heads, whereas high positive PC scores indicate more plantarly oriented MT heads. PC2 captures overall MT head robusticity, with considerable overlap between species. Wireframes represent articular shape differences of observed extremes for MT1 (PC1: −0.19–0.16; PC2: −0.10–0.12) and MT2–5 (PC1:−0.12–0.15; PC2: −0.08–0.12).

