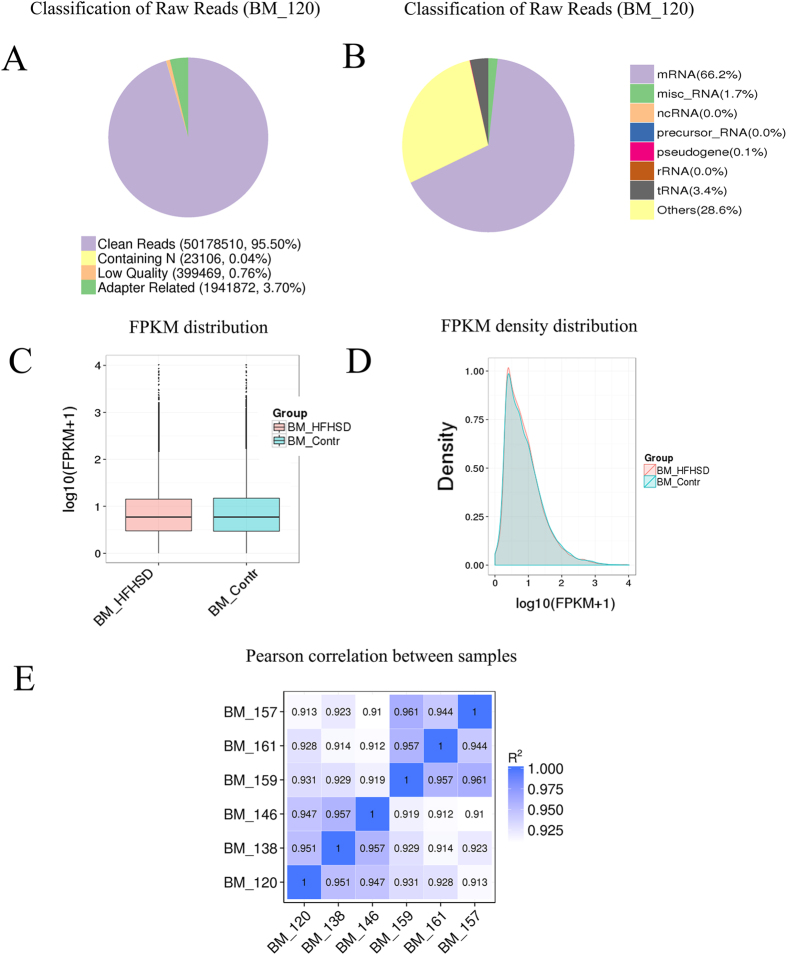
Figure 1. Reads and mapping results of RNA deep sequencing.
(A) The quality of the raw reads. (B) Classification of raw reads, mRNA near 60%, followed by tRNAs, microRNAs, and pseudogenes for pig 120; other information is shown in Supplementary Figure 2. (C) The FPKM distribution is shown with a box plot. (D) FPKM density distribution for all transcripts. (E) The Pearson correlation coefficients for all pigs.

