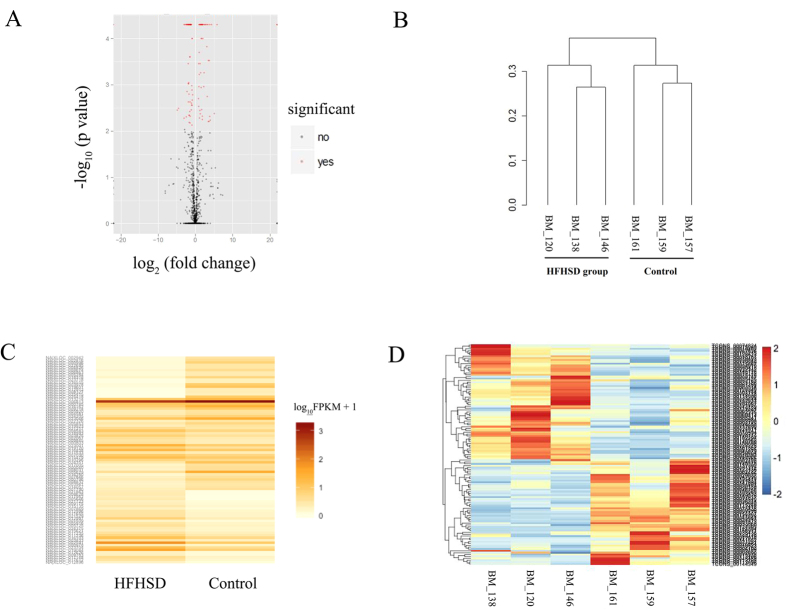
Figure 4. Characteristics of lncRNA expression levels between the HFHSD and control groups.
All lncRNA expression levels are shown; differentially expressed lncRNAs are shown in red and the others in black (A). A cluster dendrogram of the lncRNAs analyzed in six minipigs (B). The Heat map shows the expressed lncRNAs (P < 0.05) in the two groups (C). The differentially expressed lncRNAs in three pigs in the HFHSD group and three pigs in the control group were analyzed for cluster patterns (D).

