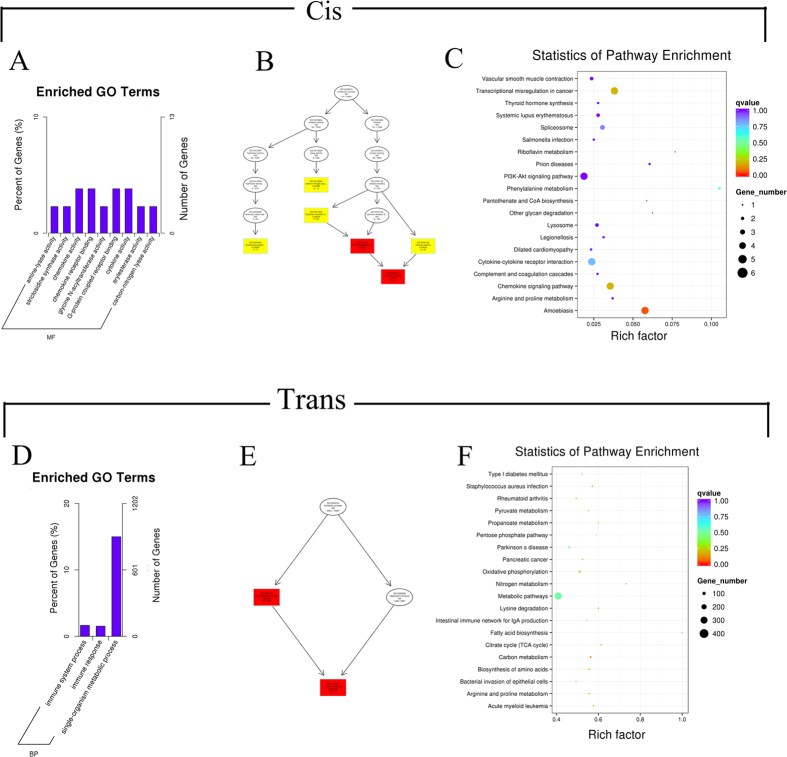
Figure 5. The prediction and functional analysis of target genes regulated by differentially expressed lncRNAs between the HFHSD and control groups.
For cis interactions, lncRNA target gene GO enrichment histogram (A), lncRNA target gene GO terms DAG figure, MF means molecular function, BP means biological process (B), and target genes KEGG enrichment scatter plot (C). For trans interactions, GO enrichment histogram (D), GO terms DAG (E), and KEGG enrichment scatter plot (F).

