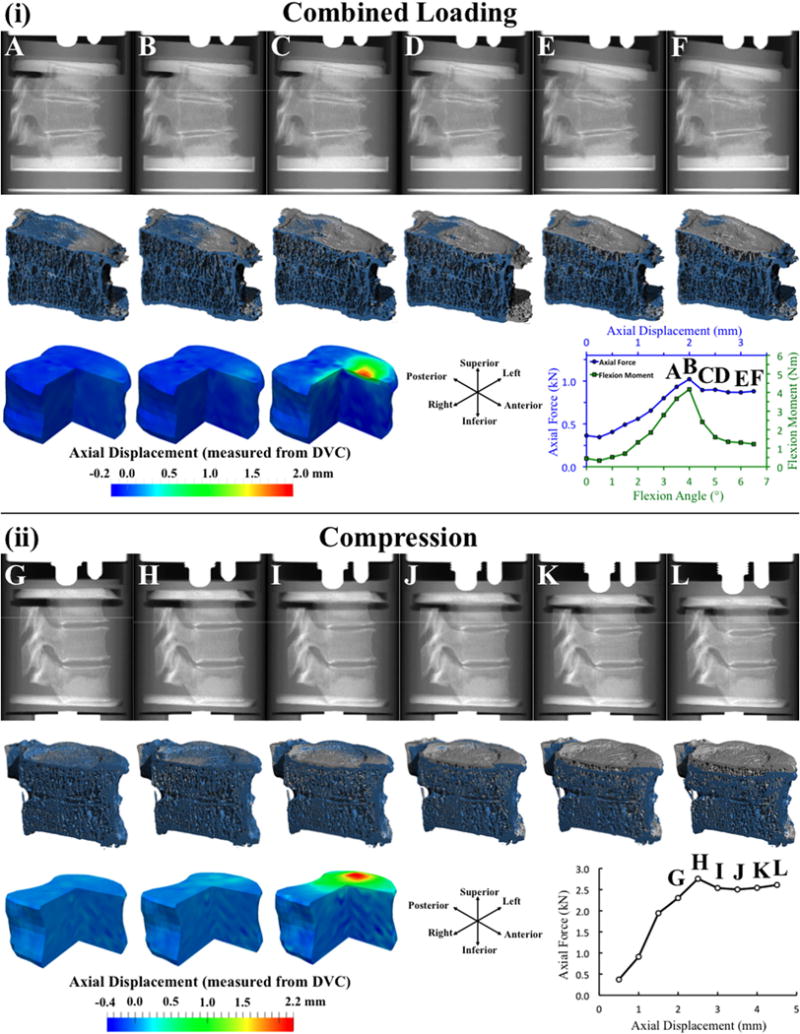
Fig. 2.

(i) For combined loading: (top row) Lateral radiographic views (created from the μCT scans) at six consecutive loading increments labeled with letters A–F on the force-displacement curve at the bottom right; (middle row) 3D rendering of a sagittal half-section of the T8 vertebral body at the current load increment (blue; the increment corresponds to the lateral radiographic view above) registered against the rendering prior to loading (gray); (bottom row) For increments A–C, three-quarter section views of the displacement map showing displacement in the axial direction (positive values indicate downward displacement); (ii) Same presentation as in (i), but for compression loading. The force-displacement curves in (i) and (ii), and the moment-angle curve in (i) depict the values of axial force, flexion moment, axial displacement and angular displacement applied to the entire T7–T9 spine segment, as opposed to those applied or experienced only in T8. The specimens shown in (i) and (ii) are each representative for the loading mode.
